9.3
8.833 reviews

English
EN
Precious metal prices were able to recover somewhat over the past few weeks. Silver significantly outperformed gold. By mid-May, gold’s return since the start of 2026 stands at 8%. For silver, that figure has risen to 19%. These returns are identical in dollars and in euros.
Due to silver’s outperformance, the gold/silver ratio has fallen to its lowest level since the end of January.
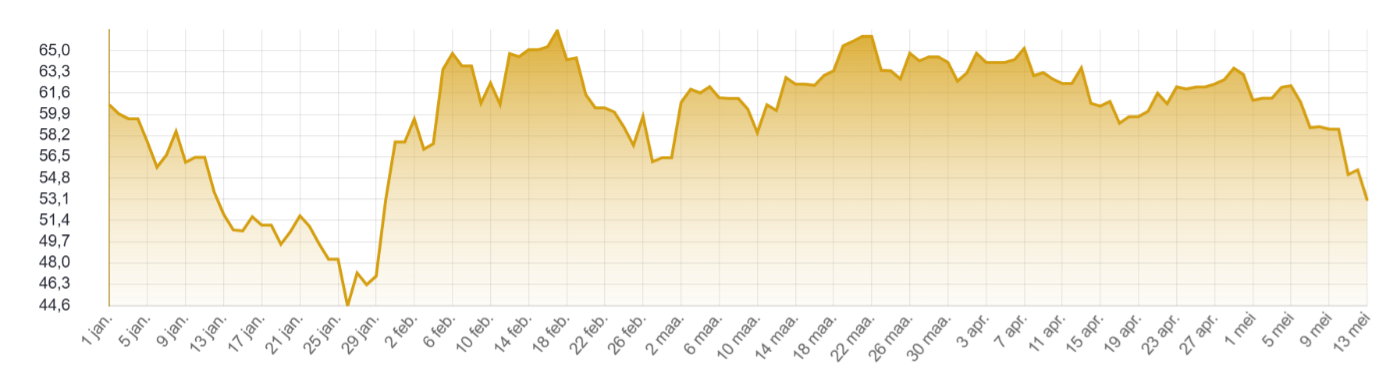 Chart: gold/silver ratio since 1/1/26 (Source: HollandGold)
In the United States, the consumer price index (CPI) rose by 3.8% year-on-year in April. That is the highest figure since May 2023. Core inflation, excluding food and energy, climbed by 2.8% to its highest level since January 2025. Both figures are well above the Federal Reserve’s target. Producer prices (PPI) even increased by 6% year-on-year. Even so, the likelihood of a change in the policy rate in the short term appears small. Due to higher inflation, the long-term interest rate (US 10Y Treasury yield) has also risen to 4.49%, its highest level since last summer.
At the moment, there are few alternatives to gold as inflation protection. Rising long-term interest rates are putting bond prices under pressure. The major stock indices are trading near historic record levels, and valuations are high on average. Cash is not a good idea either, as the real interest rate is negative, which erodes purchasing power.
Gold’s 200-day moving average, an important technical support level, is currently around 4,330 dollars.
In India, Prime Minister Modi called on the population to temporarily import fewer precious metals. To make this somewhat more compelling, the import duty on gold and silver was raised from 6% to 15%. India is the world’s second-largest consumer of precious metals. The underlying idea is that India’s foreign exchange reserves are under pressure due to high energy prices.
India has to import 85% of the energy it consumes, and this weighs on the local currency, the rupee. In 2025, India imported an average of 53 tonnes of gold per month. In January and February of this year, this figure rose to 83 tonnes, accounting for 11% of total Indian imports. A temporary reduction in precious metal imports should help ease the pressure on the rupee somewhat.
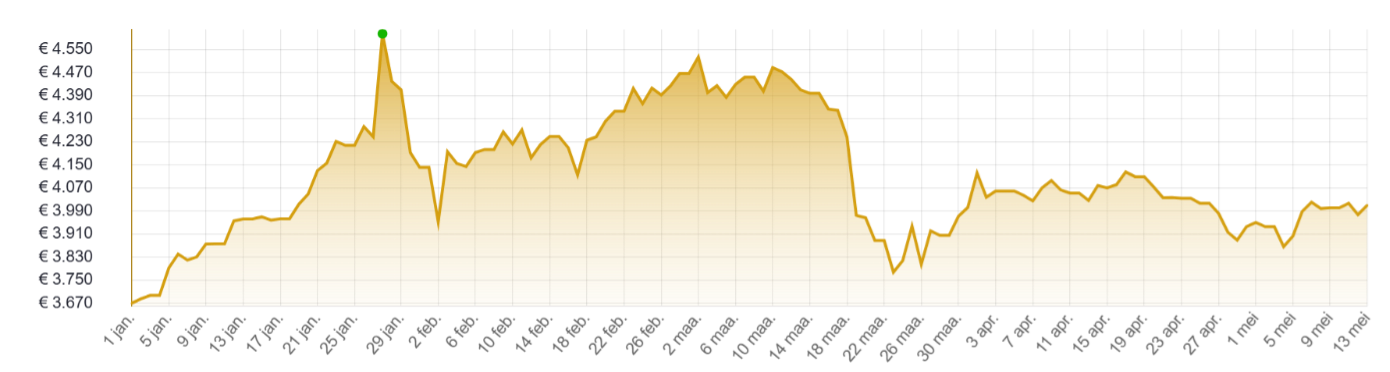 Chart: gold price on 13 May, since the start of 2026, in EUR per troy ounce (Source: HollandGold)
Central banks were net sellers of physical gold during the month of March. This is shown by the most recent report from the World Gold Council (WGC).
On balance, 30 tonnes of gold were sold. The largest sellers were Turkey with 60 tonnes, Russia with 16 tonnes and the State Oil Fund of Azerbaijan (SOFAZ) with 22 tonnes. Strictly speaking, the latter is not a central bank and therefore does not belong in the statistics, but it is a sovereign wealth fund that invests oil revenues.
The central bank of Poland was on the buying side with 11 tonnes, as were those of Uzbekistan (9 tonnes), Kazakhstan (6 tonnes) and China (5 tonnes). Guatemala and Czechia each added 2 tonnes. Over the full first quarter, central banks jointly purchased 243.7 tonnes of physical gold.
For the selling parties, gold is playing its role as a provider of liquidity when this is needed for whatever reason. In Russia’s case, it is about generating income, while Turkey wanted to protect its own economy and currency. Meanwhile, Turkey has already started to reverse part of the swap agreements (gold pledged as collateral for dollar liquidity).
The Chinese central bank (People’s Bank of China, or PBOC) has meanwhile reported a gold purchase of 8 tonnes for April. This is therefore not yet included in the WGC’s Q1 statistics. It is the 18th consecutive month that the PBOC has bought gold. China’s official gold reserves had thereby risen to 2,321.5 tonnes by the end of April. This puts China in fifth place after the United States, Germany, Italy and France. Note: this refers to the official figure released by the PBOC, but it is generally assumed that Chinese sovereign wealth funds also hold large quantities of gold.
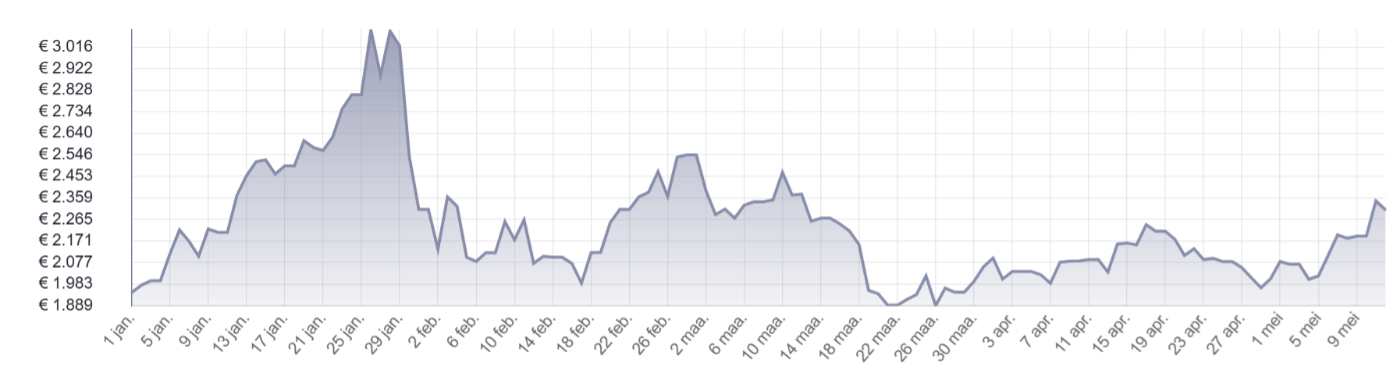 Chart: silver price since 1/1/26, in EUR per kilogram (Source: HollandGold)
The rising market penetration of EVs is good news for silver. EVs use approximately 75% more silver than a car with a conventional combustion engine. The European Automobile Manufacturers’ Association, or ACEA, reported that the market share of EVs rose to 19.4% in the first quarter, compared with 15.2% last year.
Plug-in hybrid and conventional hybrid vehicles, both of which are also equipped with an electric motor, albeit a smaller one, have a combined market share of almost half. The share of petrol and diesel in new registrations has fallen to 30.8%. In addition to the silver used in the vehicles themselves (1 to 2 troy ounces), the precious metal is also used in charging infrastructure. A DC fast-charging station can contain up to 50 troy ounces of silver.


