9.3
8.775 reviews

English
EN
Financial markets are gripped by the war in the Middle East and the inevitable rise in oil and gas prices. Gold and silver have also been pushed sharply lower from their recent highs, just like most equity indices. So far, the decline remains fairly orderly and there is no sign of panic yet. What does this mean for gold and silver in the period ahead?
The positive momentum that pushed precious metal prices to new records in January has now completely faded and given way to negative sentiment. Silver appears to be heading back toward the low seen in early February, when the price plunged from 120 to 70 dollars in just a few days. The gold price closed that same day at 4,660 dollars, while an intraday level of 4,400 dollars was touched. That was more than 20% below the peak reached at the end of January. Gold also appears to be heading toward a retest of this low.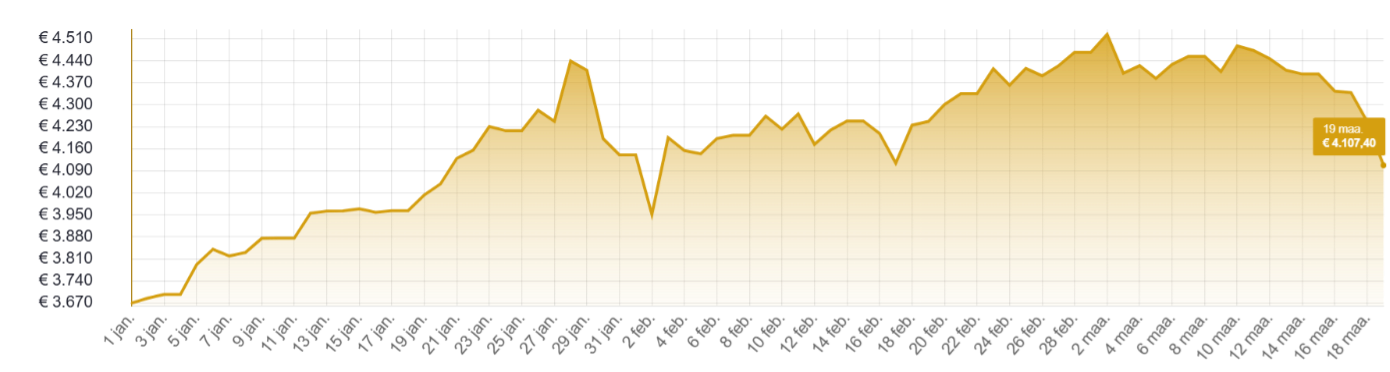
Gold price since 1/1/26, in EUR per troy ounce (Source: Holland Gold)
Besides oil and gas, and several related assets such as fertilizers, there is in fact only one major winner: the US dollar. The energy independence of the United States, higher inflation and therefore the prospect of fewer rate cuts gave the US currency fresh momentum. The combined short position of all currencies against the dollar has fallen by 80% in three weeks. As a result, the dollar index (DXY) climbed back above 100, while the dollar reached its highest level against the euro since last summer. The strong dollar somewhat softened the decline in gold measured in euros. Even after the recent correction, gold is still trading 13% higher in dollars and 15% higher in euros since the start of this year.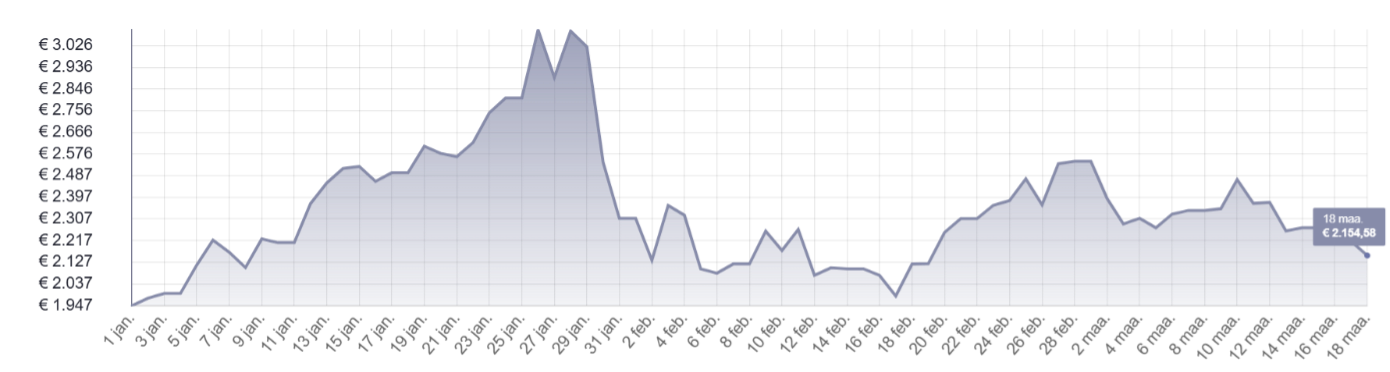
Silver price since 1/1/26, in EUR per kilogram (Source: Holland Gold)
The current market situation makes it interesting to examine how the gold price reacted to previous oil price shocks. Heraeus Precious Metals carried out this analysis for several periods, showing that the impact varies depending on whether the economy was already in recession or not.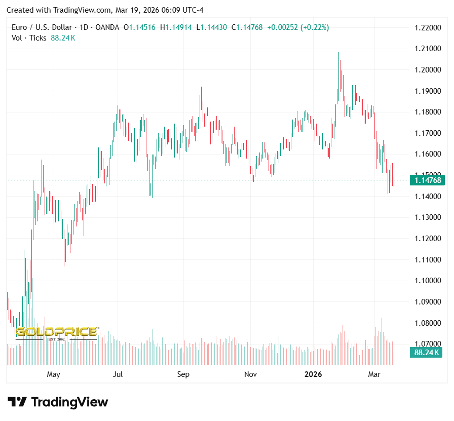
Euro/dollar over 12 months (Source: TradingView)
During the 1973 oil shock following the Yom Kippur War, gold was already in an upward trend. Initially, the gold price continued to rise and only moved lower more than a year later, when the economy entered recession. The same pattern was seen during the Iranian Revolution of 1979, when gold only started to decline after the 1980 peak following the sharp rate hikes introduced by then Fed chairman Paul Volcker.
At the start of the 1990s, the economy was already in recession when the Gulf War broke out, and gold was also in a downward price trend at that time. Russia’s invasion of Ukraine in 2022 occurred when the global economy was recovering from the Covid crisis. That energy crisis did not trigger a new recession, and gold ended the year almost unchanged.
Everything now depends on how long the violence in the Middle East continues. The longer it lasts, the greater the risk of a global recession. In that context, silver, as a metal with mainly industrial applications, is more vulnerable than gold. Nevertheless, downside price risk is limited by the fact that the silver market has been in deficit for six years. Gold is also not immune to further price declines, although the arguments that have driven gold higher in recent years (central bank de-dollarisation, debt concerns) have only become stronger.
The February inflation report showed figures above expectations, while the jobs report disappointed with job losses and a higher unemployment rate. In addition, figures from previous periods were revised downward. It therefore comes as no surprise that the Federal Reserve left interest rates unchanged on March 18.
Higher energy prices affect inflation expectations and therefore also expected monetary policy. According to the CME FedWatch Tool, rate cuts are off the table for now. Before the war in the Middle East, most market participants still expected a first cut this summer. Jerome Powell indicated during the press conference following the rate decision that there will be no rate cuts as long as inflation does not decline. Other central banks are taking the same stance. The dot plot of the Federal Reserve, reflecting the personal expectations of monetary committee members, still points to one rate cut in 2026 and one in 2027.
Still, we must distinguish between inflation caused by a supply shock (which now appears increasingly likely) and inflation caused by economic overheating as a result of strong growth. Only in the latter case do rate hikes make sense. In the case of inflation driven by rising commodity prices, higher interest rates would only worsen the effects.
The Securities and Exchange Board of India (SEBI) has amended its rules to allow equity funds to hold up to 35% of their assets in gold and silver. Until now, this was not permitted, exposing these funds to substantial currency debasement risk when cash positions remained unused. These Indian funds collectively manage 385 billion dollars. Analysts expect that temporarily unused capital will partly be parked in gold and silver. India is the world’s second-largest consumer of gold and the largest consumer of silver. ETF inflows have also risen sharply there in recent months. In January, physical gold ETFs held 110.5 tonnes of gold.
Also take a look at our YouTube channel
On behalf of Holland Gold, Paul Buitink and Yael Potjer interview economists and macroeconomic experts. The goal of the podcast is to give viewers a clearer understanding and more guidance in an increasingly fast-changing macroeconomic and monetary landscape. Click here to subscribe.


