9.2
8.899 reviews

English
EN
The precious metals market has entered correction mode. After weeks of sideways to slightly declining prices, the breach of important technical support levels triggered additional selling pressure in gold and silver. Still, this pullback does not automatically mean that the bull market is over.
After the breach of technically crucial support levels, the sideways to slightly declining price action of recent weeks turned into a sharp correction, with more and more precious metals investors throwing in the towel.
The gold price had been trapped for quite some time between a still-rising long-term moving average (200 days is usually used as the reference) and a declining short-term moving average (50 days). These indicate the long- and short-term trend, respectively. The gold price therefore had to show its true colours sooner rather than later, and it did so, unfortunately by falling below the support level.
This accelerated the decline, quickly pushing the gold price several hundred dollars lower. The same story applies to silver, which also saw the support of its long-term moving average give way.
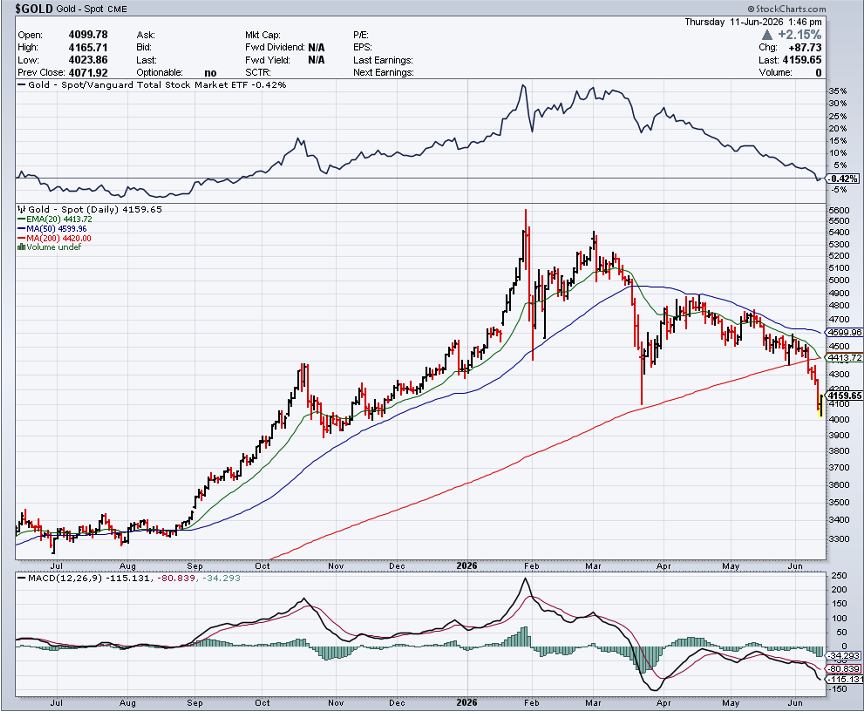 Chart: gold price over 1 year with 50d and 200d averages (Source: StockCharts)
The scale and speed of the correction should not come as a surprise, as it is algorithms and momentum traders that determine price action at such moments. Fundamental arguments temporarily fade into the background. Gold is now trading 5% lower in dollar terms than at the start of 2026, and 3.5% lower in euros. For silver, these figures are -10% and -8.5%, respectively.
Corrections are never pleasant for those holding a long position, but they are a crucial part of a rising gold cycle. The gold price is now trading 27% below its late-January peak. The gold bull market of the 1970s saw several corrections, with the average pullback amounting to 28%. Between 2001 and 2011, the average was 24%, albeit with outliers above 30%. This is no guarantee that the gold price will not fall further from here, but it is at least an indication that the correction is already well advanced.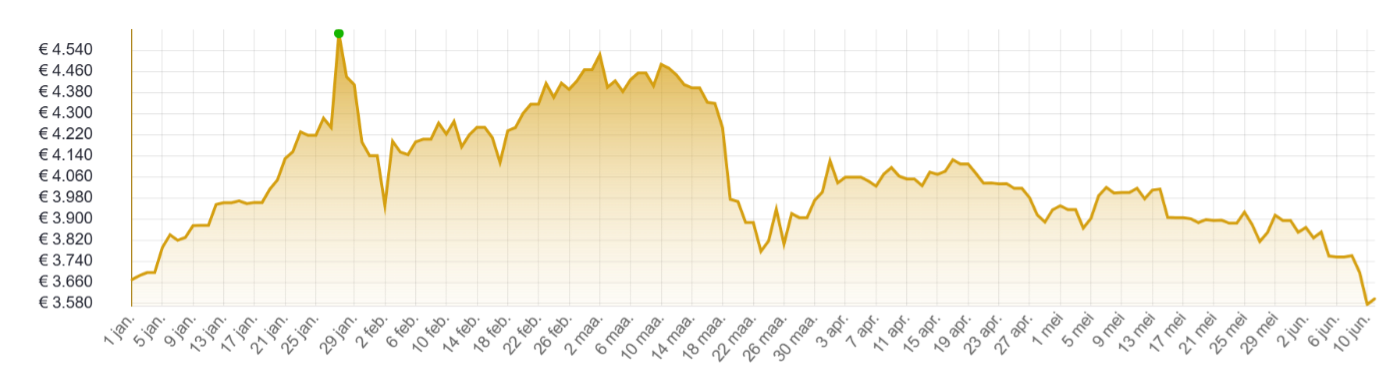
Chart: gold price since 1/1/26, in EUR per oz (Source: HollandGold)
If there had been excessive optimism, there has now clearly been a reset, with the bears gaining the upper hand. The reason for the shift in sentiment towards gold lies in the prevailing inflation narrative. Financial markets are focused on higher inflation expectations as a result of elevated energy prices and their indirect effects on the prices of other goods and services. This pushed up long-term interest rates, which in turn made the dollar more attractive. Both factors are unfavourable for gold in the short term, and this also explains why geopolitical unrest is not, for now, leading to higher prices.
The May inflation report confirmed the upward pressure on prices. The consumer price index (CPI) rose by 4.2% year-on-year, the highest reading since April 2023. In April, CPI had still stood at 3.8%. On a monthly basis, prices rose by 0.5%, compared with 0.6% a month earlier. Core inflation, excluding food and energy, rose by 2.9% year-on-year and 0.2% month-on-month in May. That was below the expected 0.3% and April’s 0.4%.
The focus on rising interest rates and a stronger dollar is putting pressure on precious metals prices. As a result, the structural factors that had driven the rise in the gold price since the beginning of 2024 are fading into the background. But this is only temporary, as central bank gold purchases have not stopped and concerns about high government debt remain. Precisely because of this debt and rising interest costs, higher real interest rates are unsustainable in the long run. The only way to keep debt and interest costs manageable is through negative real interest rates, where inflation is higher than the interest rate.
The European Central Bank (ECB) raised its policy rate for the first time since 2023, by 25 basis points to 2.25%. This policy rate in the eurozone remains well below the level in the United States. At 3.2%, inflation is also lower there, although the US economy is growing faster than the European economy.
It is unlikely that the Federal Reserve will do the same next week, on 17 June. According to the CME FedWatch Tool, 98% expect Kevin Warsh, in his first meeting as chairman of the US central bank, to leave interest rates unchanged. After that, market views diverge on the impact of higher inflation on monetary policy. For the 29 July meeting, only 10% still expect a rate hike, but that figure rises to 39% for the 16 September rate decision.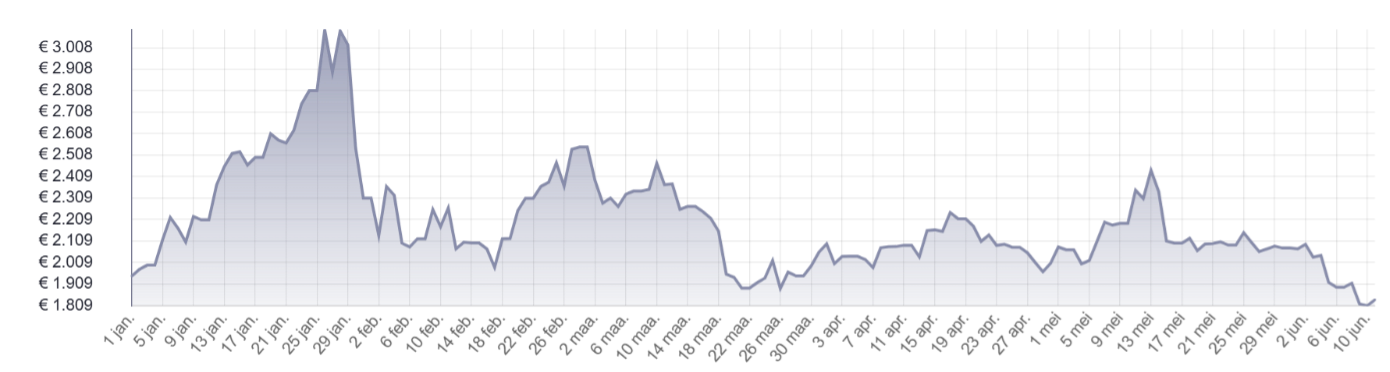
Chart: silver price since 1/1/26, in EUR per kilogram (Source: HollandGold)
An ECB report shows that gold has dethroned US government bonds as the main reserve asset of central banks. At the end of 2025, gold accounted for 27% and US Treasuries for 22%. The dedollarisation trend is therefore continuing. In May, the Chinese central bank bought another 9.95 tonnes of gold. It was the 19th consecutive month in which the People’s Bank of China (PBOC) increased its official gold reserves.
Some patience will be needed before positive momentum returns. The good news is that the optimism seen at the start of 2026 has given way to pessimism. In the case of gold mining stocks, this is even moving towards capitulation. ETF flows also show that there has already been an outflow of 88 tonnes from physical gold trackers since the start of the year. On the Comex futures exchange, the number of speculative long positions in gold has also fallen sharply.
For now, there is little else to do but sit out the correction and wait for triggers that can turn sentiment around again and allow fundamental factors to regain the upper hand. The most obvious catalyst would be a ceasefire in the Middle East, which would push interest rates, inflation and the dollar lower again.


