9.3
8.889 reviews

English
EN
It's been a week since the report of In Gold We Trust (IGWT) has been published. Last week we wrote about the Highlights of the report. IGWT described two decisive factors for the Gold priceSo-called Showdowns. Based on the showdowns, IGWT saw the outlook for bullion as promising. However, there is much more in the report of more than 400 pages, including the Incrementum Recession Phase Model (IRPM). What is the IRPM model and why is it important?
During recessions, it is difficult to estimate what different asset titles will do. Are prices of stocks, gold, Bitcoin and commodities rising, or are they on a downward pattern? There is often a general picture of price developments. For example, gold is known as a beacon of security, which is why the price of gold often rises in times of uncertainty. Shares often take a hit during crises and often fall in value. Yet the reality is more complex. Various models have therefore been drawn up to draw up an investment strategy.
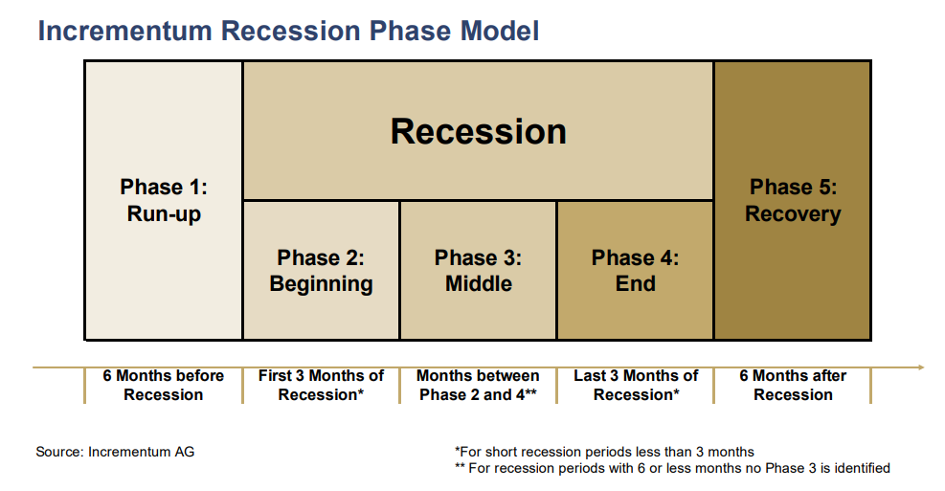
For example, there is IGWT's IRPM model, which can help investors create a good strategy when the economy is in dire straits. The model describes five different phases of a recession. For example, the first phase is the run-up to a recession, in which there is higher volatility in financial markets. This is followed by three phases in which the recession is felt. In the initial phase of the recession, phase two of the model, negative growth can also be seen in macroeconomic data for the first time. This is followed by the low point of the crisis, phase three. Phase four is the end of the crisis, in which markets stabilise again and there is growing optimism. Finally, there is the recovery phase, in which the economy is picking up again and better figures are visible, phase five.
Unlike other models, the IRPM model describes the impact each stage has on asset titles. By dividing the crisis into different phases, one reduces the risk and can increase the return on a portfolio. But because the phases are so important for the model, it is very important to recognize different phases in time, which is often difficult.
For example, it is difficult to say exactly what phase of the model we are in at the moment. There is talk of Volatility in markets and the Dutch economy Shrank in the first quarter of 2023. We also wrote about the Inverted yield curve, which is often a harbinger of a recession. So that would point to phase one or two of the model. On the other hand, there is only officially a recession if there are two consecutive quarters of negative growth. Should a possible recession be averted by positive growth in the current quarter, have we really been in phase two of the model, or have we?
IGWT has studied several recessions and has broken each recession into different phases. Based on different phases, the returns in each phase can also be seen for stocks, gold, commodities and silver.
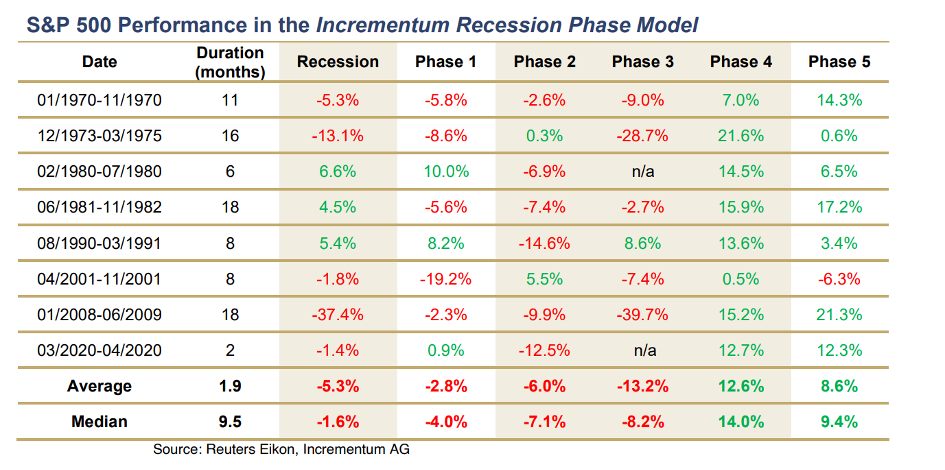
For equity markets, there is a clear difference in the five phases. In many recessions, there is already a period of downturn in the run-up to which stocks fall in value. The first two phases of the recession also often bode well for stock prices. In the final phase of the recession, optimism picks up again and green figures can be admired, before increasing further in the recovery phase (except in 2001). On average, the value of stocks decreases by 5.3 percent during a recession. However, this picture is not entirely accurate, as the crisis in 2008 showed such a large decline that IGWT labels that recession as an outlier. The median shows a more moderate decrease of only 1.6 percent.
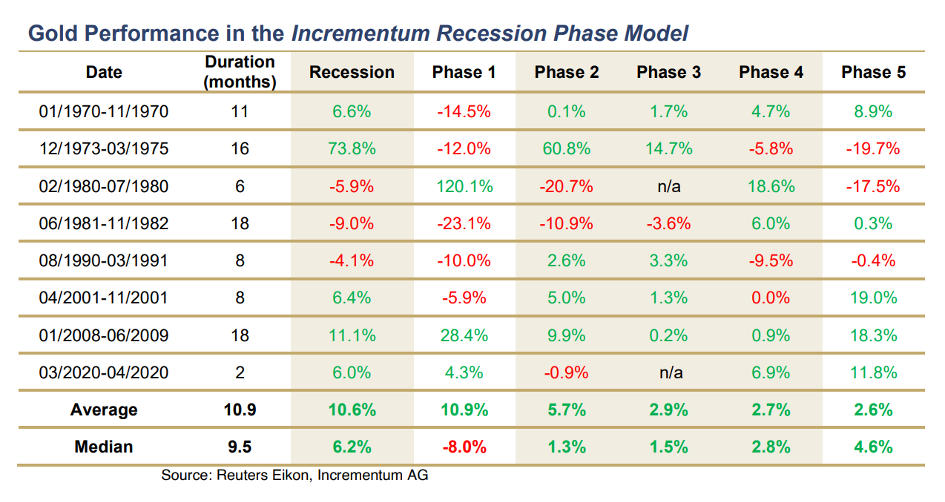 The table shows that, on average, gold rose at each stage. A side note is that there are outliers and that the median only shows red figures in the first phase. For example, the price of gold rose in the run-up to the Volckerschock in 1980 by more than 120 percent. On the other hand, the gold price fell in the run-up to other recessions. Nevertheless, it can be seen that gold often does well in uncertain times. For example, the price of gold rose at every stage of the crisis in 2008, while stocks, for example, fell by almost 40 percent during that time. On average, the price of gold rose by 10.6 percent during a recession and the median was 6.2 percent. Overall, gold did particularly well in phases 2,3,4 and 5, while equities only showed positive numbers in the fourth phase. Gold as a beacon in uncertain times seems to have been reaffirmed.
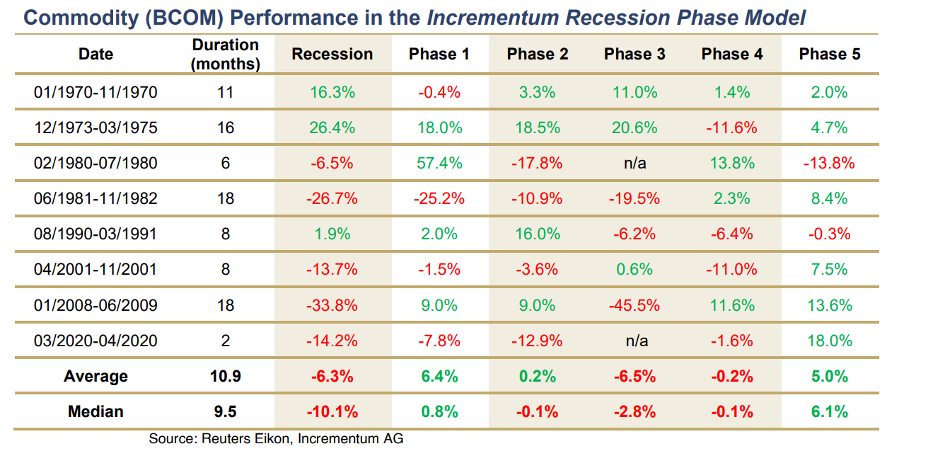
If we look at the commodity index, commodities seem like a bad investment in times of recession. With an average return of -6.3 percent and a median of -10.1 percent, commodities still place below equities during a recession. However, raw materials do well in phases one and five of the model. This is because the median and average of the commodity index turn green in the run-up phase, while gold has a negative median, as the precious metal gave up in the run-up to several recessions. In phase two, the index outperforms equities but underscores gold.
Commodities appear to score relatively poorly, especially in the third phase, the point at which the economy reaches a low point. Production is then at a low level, which means that the demand for various raw materials is relatively low. According to IGWT, commodities are indeed a good option in the run-up to the recession and in the recovery phase, but they do not perform well in phase three of the model.
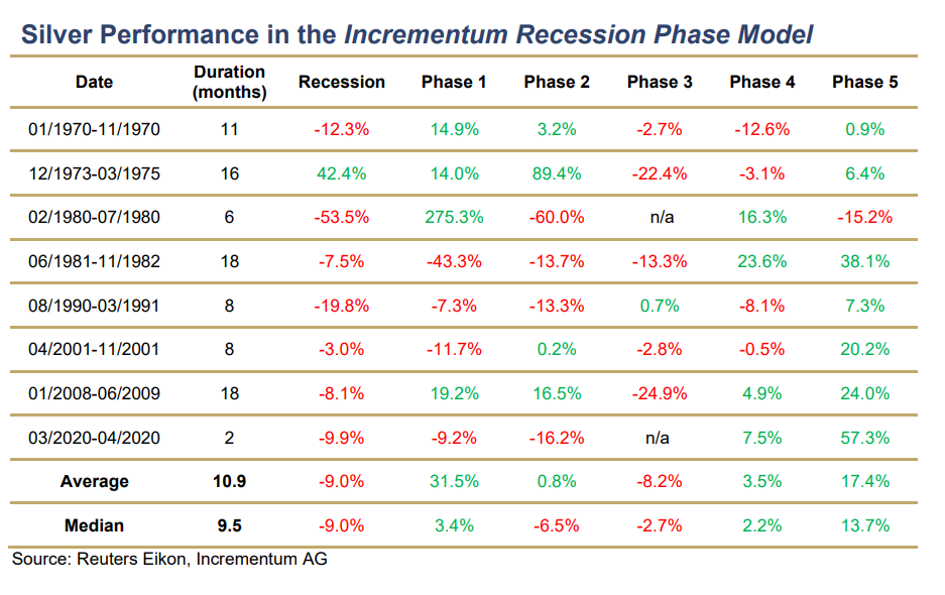
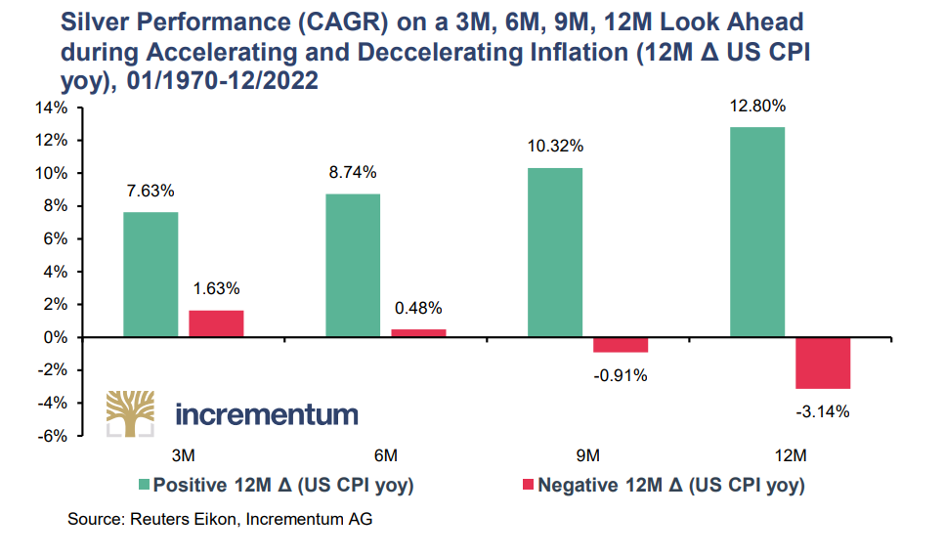
Since silver has both monetary and industrial value, the precious metal differs from other commodities. Looking at the table, we see that silver, like commodities, is doing badly on the face of it. Both the mean and median show a negative return of 9 percent. Still, silver is doing very well in the run-up and recovery phase, and the precious metal is not performing badly in phases two and four either. Since about half of the demand for silver is industrial in nature, the cyclical nature becomes especially visible during a deep recession. Then the price falls because the demand for silver falls. This price drop is often offset in other phases. For example, silver does well during periods of rising inflation, as the following chart shows.
The model therefore provides more clarity in which asset titles are valuable in different phases of a recession. For example, stocks rise especially at the end of a recession and perform poorly as the recession approaches. Raw materials, on the other hand, tend to hold their value in the early stages and perform worse when the recession is felt. Silver does especially well in the run-up and recovery phases, while gold does well in all phases. How the economy develops in the near future depends on many factors. It may be that we are now in phase one or two and that phase three will follow in a few months. That's similar to what Jeroen Blokland in a podcast on Holland Gold Pointed out. In such a case, the price of gold could rise further in the near future. It is also possible that inflation will fall in the near future and then the economy will pick up again. In that case, equities will do better again. Time will tell what phase we are in now.
![]() Have a look at us YouTube channel
Have a look at us YouTube channel
On behalf of Holland Gold, Paul Buitink and Joris Beemsterboer interview various economists and experts in the field of macroeconomics. The aim of the podcast is to provide the viewer with a better picture and guidance in an increasingly rapidly changing macroeconomic and monetary landscape. Click here to subscribe.


