English
EN


The gold market remains caught between persistent inflation, rising interest rates and geopolitical uncertainty. While investors continue to focus on oil and AI-related stocks, gold is once again testing a crucial technical support level. In this market analysis for May 28, 2026, we examine the impact of Federal Reserve policy, the evolution of inflation, the outlook for interest rate cuts and the technical setup for both gold and silver. Despite the recent correction, the long-term trend for precious metals remains intact by historical standards.
Gold has been trading within a relatively narrow range for quite some time, with daily sentiment largely driven by developments in the Middle East. Trading volumes remain low while market momentum has shifted back toward oil and AI stocks. After nearly five months in 2026, gold is trading 3% higher than at the start of the year. In euro terms, the return is slightly stronger at 4%. For silver, those gains amount to 4% and 5% respectively. The gold-to-silver ratio climbed back to 60 after hitting a low of 53 just two weeks ago.
Since the outbreak of the military conflict in the Middle East, the gold price has corrected by approximately 15%. Markets are mainly focusing on rising inflation and increasing long-term interest rates. Nevertheless, long-term bond yields have been rising since 2021 without preventing gold from tripling in value during that same period.
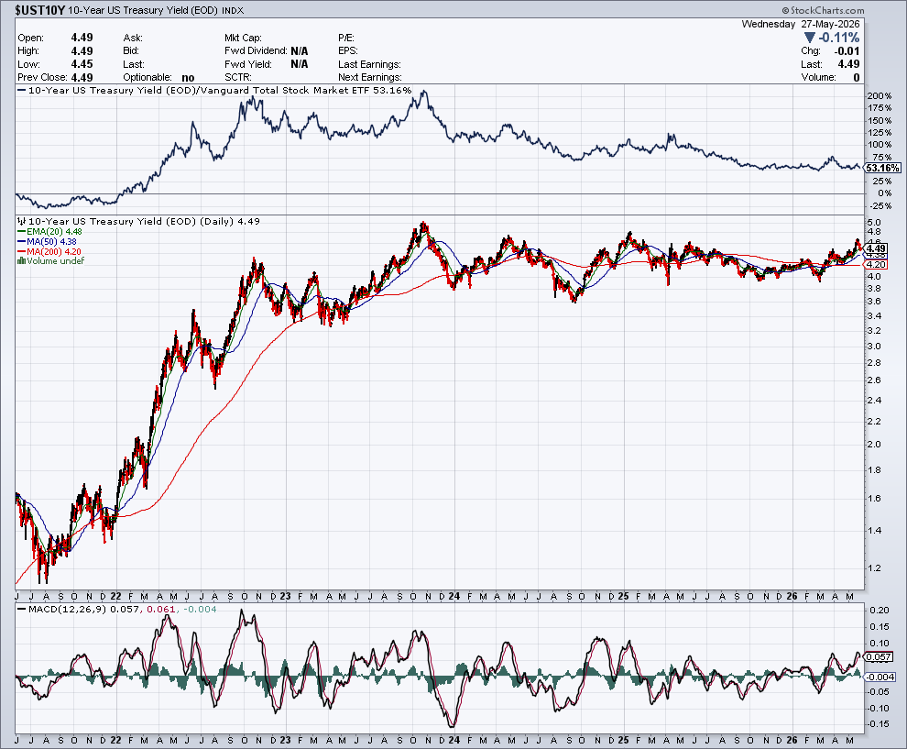 Chart: US 10-Year Treasury Yield over 5 Years (Source: StockCharts)
Inflation in the United States came in at 3.8% in April, once again well above the Federal Reserve’s target. There is little chance of a significant decline in the short term, as higher energy prices are gradually feeding through into non-energy categories, causing Core CPI (excluding food and energy) to continue creeping higher.
Even if a peace agreement were to be reached, it would likely take considerable time before energy prices return to pre-war levels, if they return at all. Demand is expected to remain elevated as strategic reserves will need to be replenished.
Inflation is therefore likely to remain elevated for some time. Meanwhile, newly appointed Federal Reserve Chairman Kevin Warsh is pushing for a different way of measuring inflation. For decades, the Core PCE has been the Fed’s preferred inflation gauge. Warsh instead favors the Trimmed Mean PCE as the basis for monetary policy. This measure is essentially Core PCE, excluding food and energy, but with the most extreme price movements removed.
The underlying idea is that consumers tend to substitute goods and services that have become significantly more expensive, or that demand for those items drops sharply. Importantly, the Trimmed Mean PCE currently stands below 2.4%, much closer to the Fed’s internal target of 2%. However, it is far from certain that this change will actually be implemented, as Warsh will first need to convince the other members of the monetary policy committee.
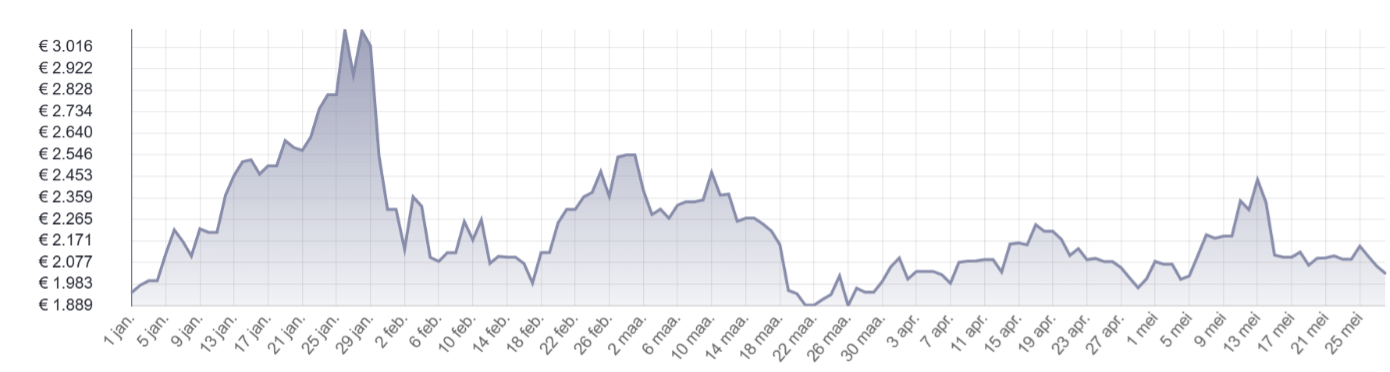 Chart: Silver Price since 01/01/26 in EUR per kilogram (Source: HollandGold)
Meanwhile, the likelihood of additional rate cuts this year appears to be fading rapidly. According to data from the CME FedWatch Tool, no rate cut is expected during the June 17 meeting, the first monetary policy meeting chaired by Warsh. Markets are also pricing in a pause for July, while 30% of investors already expect a first rate hike at the September 16 meeting. That probability rises to 40% for October and even 55% for November. Markets are not expecting a rate cut until sometime in 2027. Recent history has shown, however, that these expectations can change very quickly. Shortly before Warsh took office, the consensus was still that rates would be cut this summer.
Every correction has both a time and price component. From a technical perspective, gold has remained under pressure since mid-March when the price fell below its 50-day moving average. Every recovery rally since then has stalled at that resistance level. The long-term trend nevertheless remains upward after gold successfully tested its 200-day moving average, then around $4,100, at the end of March.
That support level has since risen to approximately $4,360. If this level fails to hold, a further decline toward $4,100 or even lower cannot be ruled out. At the same time, the gap between support and resistance continues to narrow as the 50-day and 200-day moving averages move closer together. At some point, gold will have to choose a direction. The longer this consolidation phase lasts, the stronger the base for a potential new upward move becomes.
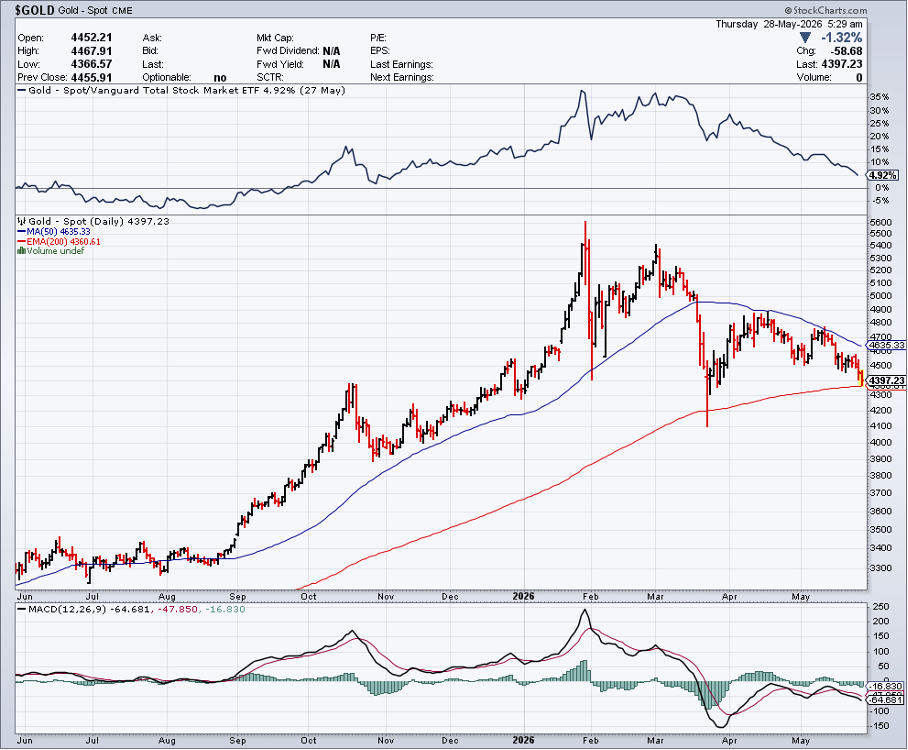 Chart: Gold Price over 1 Year with 50-Day and 200-Day Moving Averages (Source: StockCharts)
There is currently no indication that the bull market in gold has come to an end. During previous cycles, the gold price increased by a factor of 8 to 9 between the market bottom and top. This occurred between 1976 and 1980 and again between 2001 and 2011. Assuming the current cycle began in December 2015 at $1,045, the January peak of nearly $5,600 this year may still be far from the final top. From current levels, gold could therefore still double in value.
In addition, global debt levels have risen exponentially since previous gold cycles. With US federal government debt rapidly approaching $40 trillion, annual interest expenses are moving toward $2 trillion per year. The budget deficit, currently standing at $1.7 trillion, is expected to increase even further this year. The debt snowball effect is therefore far from over. Economic growth and tax revenues are no longer sufficient to fill the gap.
Higher interest rates, which currently act as a headwind for gold, could eventually become a tailwind instead. To meet all obligations, including interest payments and social spending, governments may have little choice but to print more money. The Institute of International Finance (IIF) estimates that global debt has risen to $353 trillion, equivalent to 305% of global GDP. That represents an increase of $4.4 trillion compared to the previous quarter. As interest rates continue to rise, the global cost of servicing this debt is also increasing. As a result, the purchasing power of fiat currencies continues to erode.