English
EN


The precious metals market is still searching for direction. Although gold and silver have cautiously rebounded since the end of June, the recovery remains vulnerable due to the strong dollar, high interest rates and weak investment demand. At the same time, central banks continue to buy gold, keeping the longer-term structural support intact.
The gold price has rebounded slightly since the late-June low, as inflationary pressure appears to have eased somewhat. Since the start of 2026, gold is still showing a negative return of 4% in dollars and 1.5% in euros. For silver, this rises to -15% and -12.5%, respectively. Because silver has underperformed gold in relative terms over the past period, the gold/silver ratio has risen again to its highest level since December last year.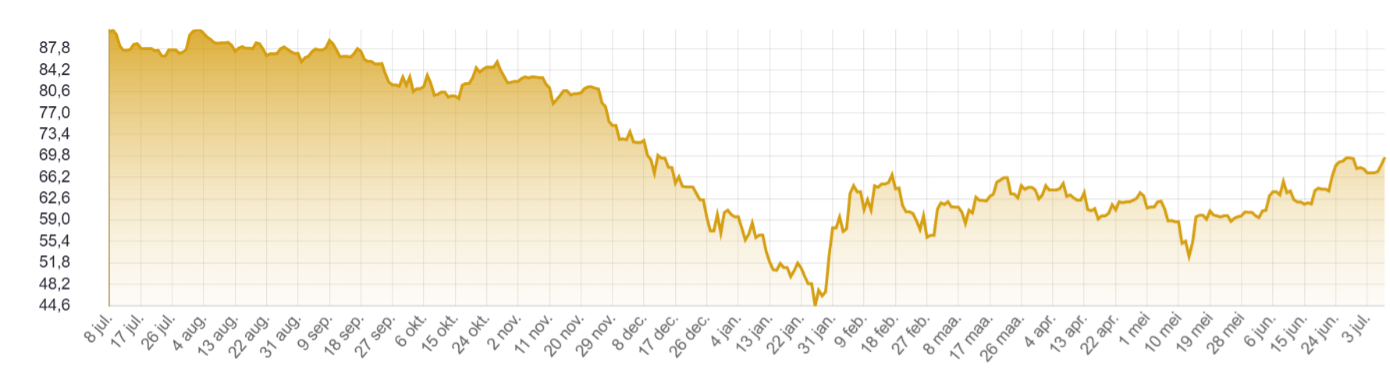
Chart: gold/silver ratio over 12 months (Source: HollandGold)
Three weeks after new Fed Chair Kevin Warsh used tough language about bringing inflation under control, energy prices have fallen sharply, although the ceasefire in the Middle East does not appear to be very stable after all. There is a strong chance that the situation will remain unsettled for quite some time. The most recent jobs report in the US certainly does not point to overheating inflation. Far fewer jobs were added last month than expected. In addition, the figures for April and May were also revised downward. In the eurozone and the United Kingdom as well, the consumer price index is showing a downward trend.
For now, this has not yet translated into the Federal Reserve’s interest rate forecasts. Based on the CME FedWatch Tool, 70% expect the US central bank to leave its policy rate unchanged on July 29. Still, 30% are already expecting a 25-basis-point hike. This figure doubles for the following meeting in September, where 60% are already counting on the rate being raised by at least 25 basis points. This figure rises to 70% for October and even 80% for December.
Warsh emphasized that economic data will determine the future path of the policy rate. The focus will therefore primarily be on inflation and jobs reports. But the geopolitical situation will of course also continue to play a role, as will the domestic political situation in the United States, where midterm elections for the Senate and Congress will take place on November 3.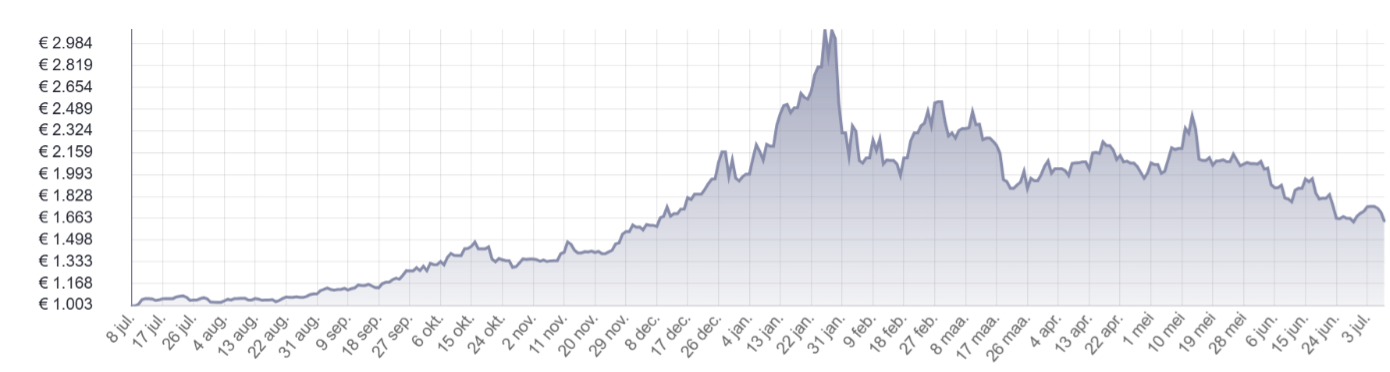
Chart: silver price over 12 months, in EUR per kg (Source: HollandGold)
Despite the modest recovery since the end of June, it is too early to speak of a renewed upward price trend in gold. High long-term interest rates and the strong dollar continue to create headwinds, while investment demand is also failing to materialize. During the first half of the year, the amount of gold under management by physical ETFs fell by 2.3%. In January and February there was still a strong inflow, but in line with the price trend, the following months saw outflows.
At the beginning of July, the gold holdings of physical ETFs fell below the 3,000-tonne mark for the first time since September last year. The picture was similar for silver, although the 9.3% outflow in the first half of the year was smaller than the price decline of the metal itself.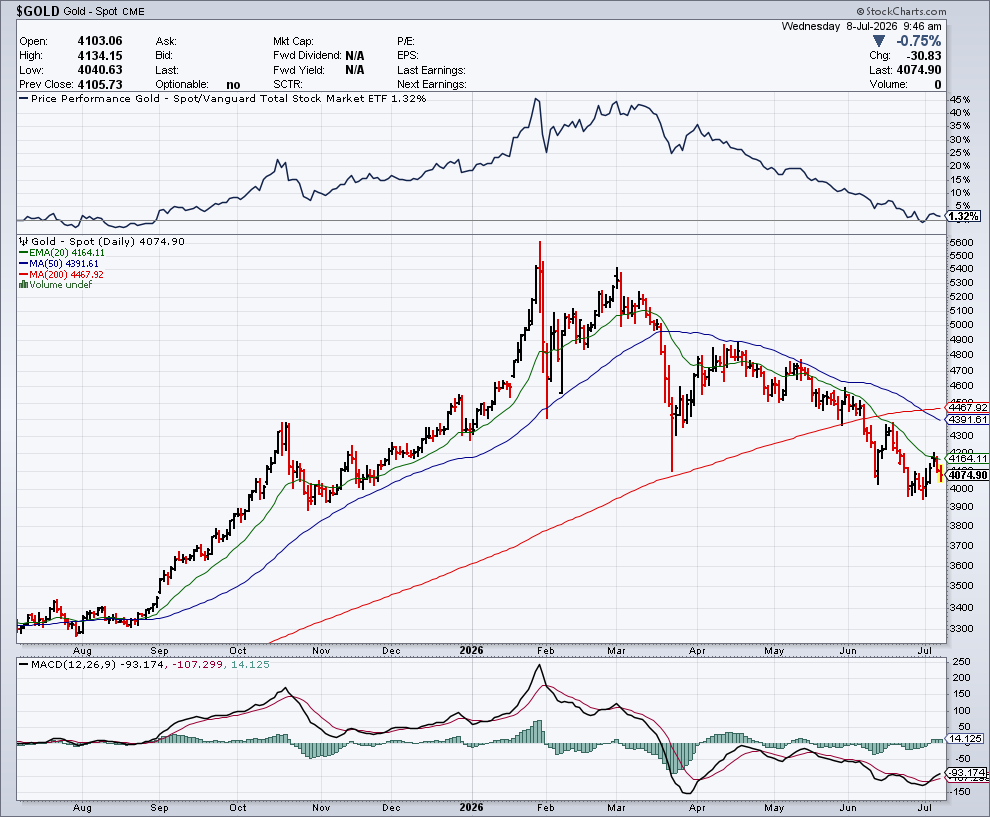
Chart: gold price over 1 year with 50-day and 200-day averages (Source: StockCharts)
The 200-day average is still rising, but the curve is now flattening rapidly. This level is also the first resistance point in a recovery move. For upward momentum to return, a trigger is needed in the form of a changed inflation narrative. Until then, the most likely scenario is a sideways price trend. This also applies to silver.
In the background, the structural factors that support the gold price over the longer term remain intact. This was illustrated by the most recent Central Bank Gold Statistics from the World Gold Council. These showed that central banks collectively purchased 41 tonnes of gold in May, the largest amount since February. Poland was on the buying side with 18 tonnes, followed by China with 10 tonnes and Singapore with 4 tonnes. Among the sellers were Russia with 6 tonnes and Turkey with 3 tonnes. Since the start of the year, Russia and Turkey have sold 34 and 81 tonnes of gold respectively, but despite the wave of selling by both countries, the overall balance for all central banks remains firmly positive.
The Chinese central bank announced that it purchased almost another 15 tonnes in June. This marks the 20th consecutive month in which China has expanded its gold reserves. The country’s official gold reserves now stand at 2,346 tonnes. This figure does not include gold held by state investment funds, as that number is not published.