English
EN


We cannot ignore the US midterm elections this week and their impact on financial markets. Initially, almost all asset classes staged a relief rally, but major equity indices have since given back virtually all of those gains. AI-related stocks and semiconductor shares in particular were hit hardest.
For gold (and silver), the traditional market correlations reasserted themselves. That was not the case at the end of last month, as we previously discussed. Precious metal prices continued to fall at the time despite lower long-term bond yields and a weaker dollar. The picture was different after the midterm elections. The Democratic victory pushed long-term yields and the dollar lower, prompting an initial rise in gold and silver prices.
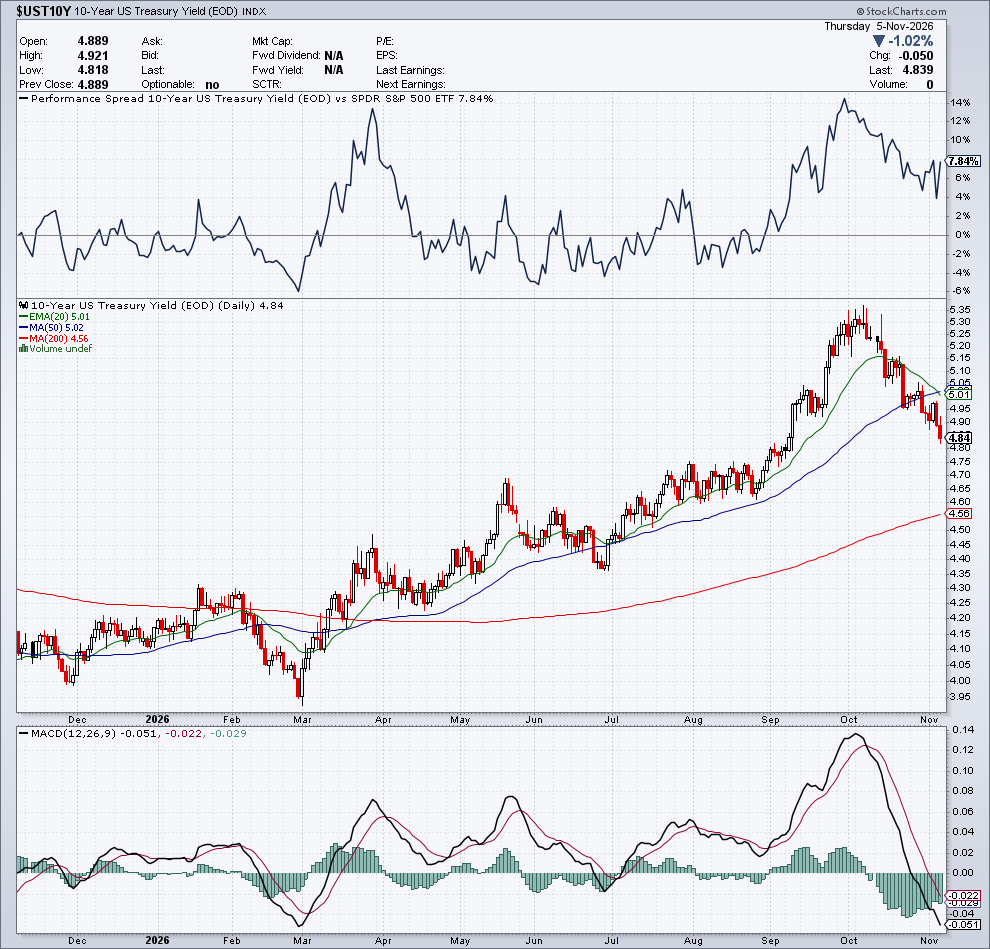 Chart: US 10-year Treasury yield over 12 months (Source: Stockcharts.com)
One possible explanation is that some money was taken off the table ahead of the elections in anticipation of a scenario in which the result would be contested. This could have led to a prolonged period of uncertainty, but that ultimately did not happen. Once President Trump acknowledged the results relatively quickly, that uncertainty faded.
Volatility remains elevated, however, and as liquid assets, precious metals remain vulnerable to forced selling and margin calls.
If Republicans want to avenge their defeat and regain the presidency in 2028, the first requirement is for the war rhetoric to disappear. If the midterms made one thing clear, it is that Joe Sixpack has had enough of the war in Iran and the resulting high energy prices.
Max Layton, head of Commodities Research at Citi, expects gold to reach $4,500 per troy ounce within the next three months. He expects the price to rise to $5,000 within 6 to 12 months. Citi does, however, attach two conditions to this forecast: the Strait of Hormuz must reopen and hostilities between the Houthis in Yemen and Saudi Arabia must also come to an end.
This would lead to lower oil prices and, consequently, lower inflation, which Layton believes would give the Federal Reserve room to cut interest rates rather than raise them. Lower rates should, in turn, boost investment demand for gold.
So far, there is still no sign of a slowdown in the pace of price increases. This was again evident from the preliminary eurozone inflation figures for October. Eurostat’s estimate showed inflation at 4%, up from 3.8% in September. On a monthly basis, prices rose by 0.4%. Energy, which accounts for 9% of the inflation basket, was by far the biggest driver, with prices up 20.8%.
Core inflation, excluding food, alcohol and energy, remained unchanged from September at 2.5% year-on-year. At 3.7%, inflation in the Netherlands is slightly below the eurozone average. Even so, it rose from 3.4% in September. Belgium stands out negatively within Europe, with inflation at 5.3%.
US inflation figures for October will be published on 10 November. They are likely to play an important role in the Federal Reserve’s final interest-rate decision of the year on 9 December. At present, 73% expect a 25-basis-point (0.25%) rate hike, while 27% expect rates to remain unchanged.
The Bank of England raised its policy rate by 25 basis points to 4% on Thursday. It was the first increase in three years. The ECB and the Fed had already done the same. Governor Bailey pointed to higher energy costs as the reason. However, it remains unclear how much a rate hike can achieve if the inflation problem is being driven by supply rather than demand. UK inflation currently stands at 3.5%. The BoE expects it to rise to almost 5% by mid-2027 if higher energy costs continue to feed through into the prices of goods and services.
The Gold Demand Trends Report from the World Gold Council revealed a notable divergence. Demand for jewellery, bars and coins fell in the third quarter, but this decline was almost entirely offset by central bank purchases and, to a lesser extent, positive ETF flows. Overall demand totalled 1,369 tonnes, 1% lower than in the same period a year earlier. After the first three quarters of 2026, total demand stands at 3,881 tonnes, just below last year’s record of 3,884 tonnes.
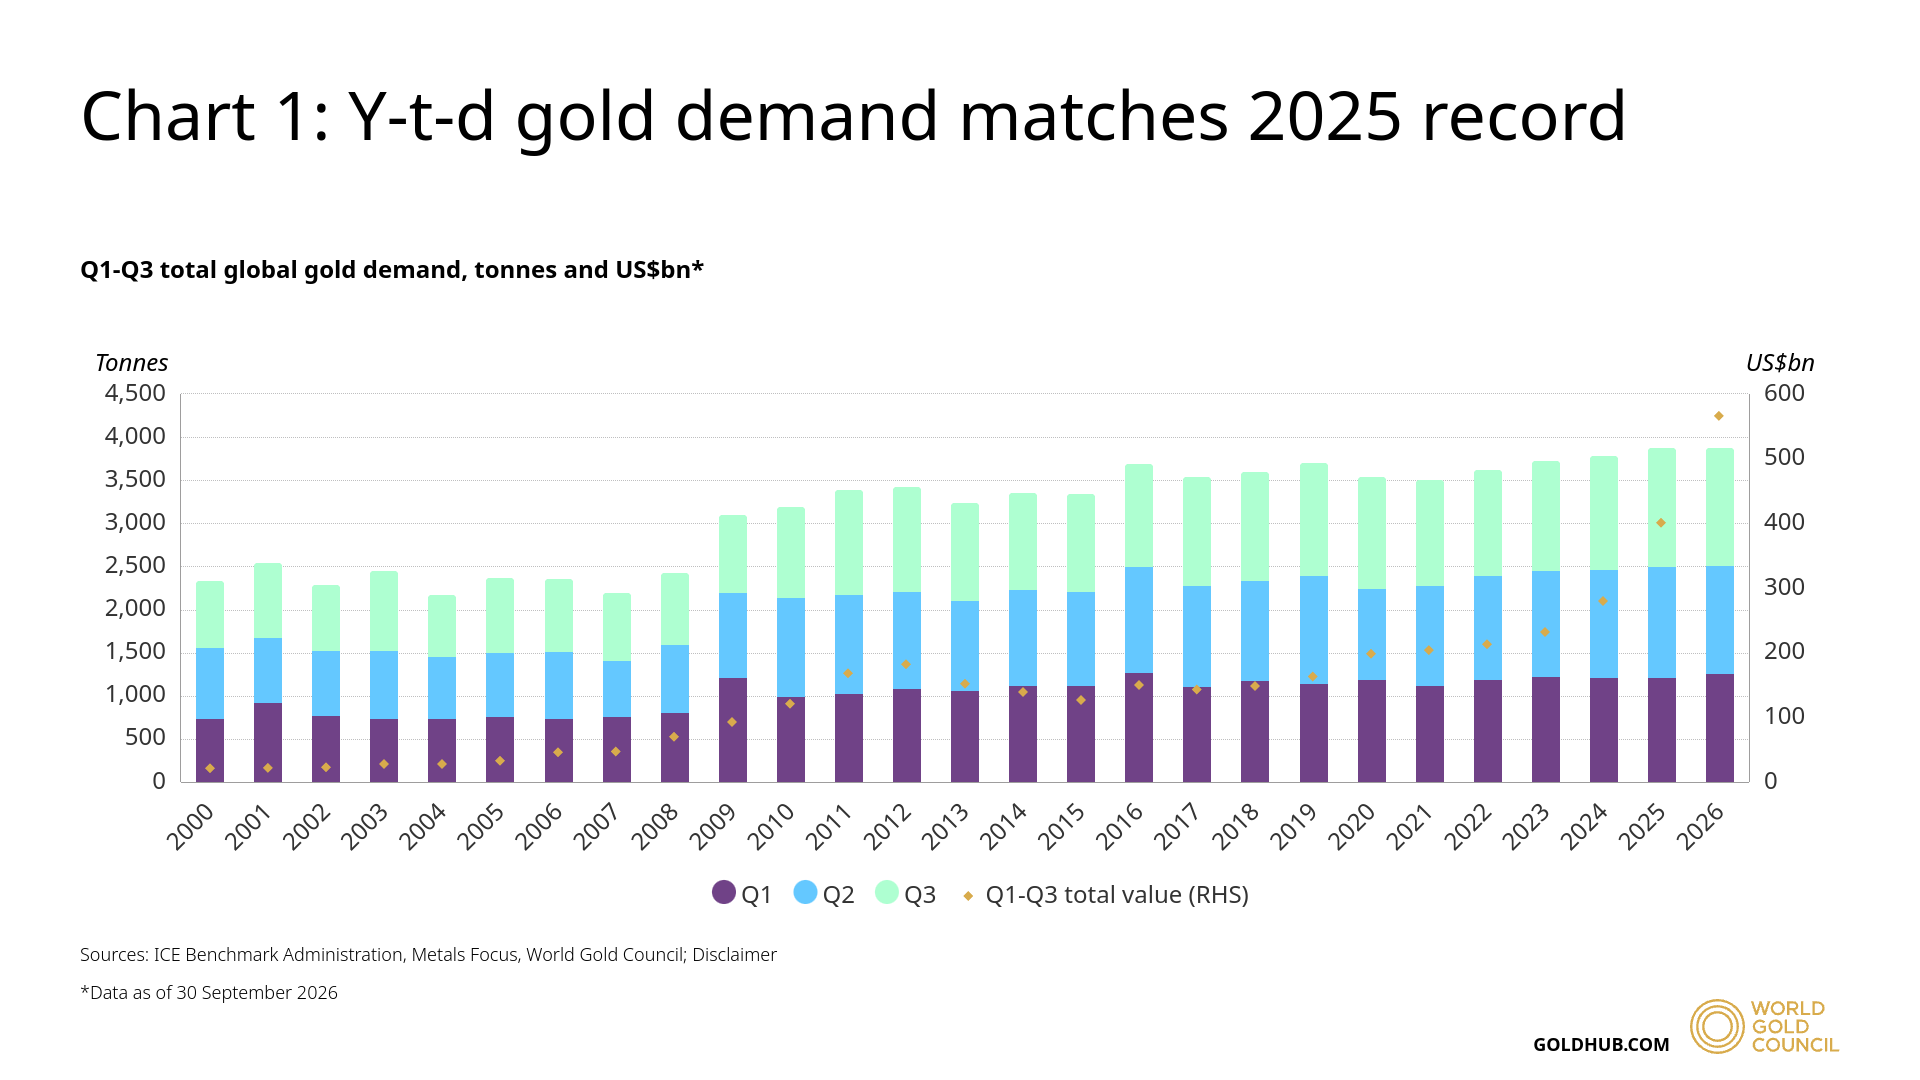 Chart: Global gold demand in the first three quarters, in tonnes and billions of dollars (Source: World Gold Council)
In value terms, however, the third quarter did set a new record at $566 billion. This was because the average gold price, at $4,262 per troy ounce, was 23% higher than in the same period last year. It should be noted that year-on-year comparisons are likely to become less favourable over the coming quarters. This is because the gold price rose sharply in the fourth quarter of 2025 and the first quarter of 2026.
Demand for bars and coins came in at 268 tonnes, 19% lower than a year earlier and the lowest level in four years. Jewellery consumption followed a similar trend, falling 17% to 313 tonnes. This was the lowest third-quarter figure since the WGC began compiling the series. In value terms, however, jewellery purchases were worth $43 billion, 2% more than a year earlier. Retail demand is traditionally highly price-sensitive and also depends on the overall level of prices and, therefore, consumers’ ability to save.
The same does not apply to central banks. They represent a stable source of demand, while the share of government bonds in their reserves has been declining for years in favour of gold. Central banks purchased a combined 321 tonnes of gold between July and September, 42% more than a year earlier. China and Poland in particular have already been highly active this year. After the first three quarters of 2026, total demand stands at 675 tonnes, 6% more than last year.
The WGC expects total demand this year to be at least in line with 2025. Central banks purchased a combined 863 tonnes of gold that year. An important caveat regarding central bank figures is that only part of their purchases are officially reported. Not all central banks disclose changes in their gold holdings. The WGC estimates unreported transactions and reports them as over-the-counter (OTC) transactions. When central banks subsequently report purchases with a delay, the WGC may need to revise its original figures. This recently happened with the first-quarter figures.
Another interesting finding in the report is that, for the past four years, there has been a negative correlation of -0.7 between movements in the gold price and central bank gold purchases in volume terms. Put differently, central banks buy less gold when prices are higher and more when prices are lower.
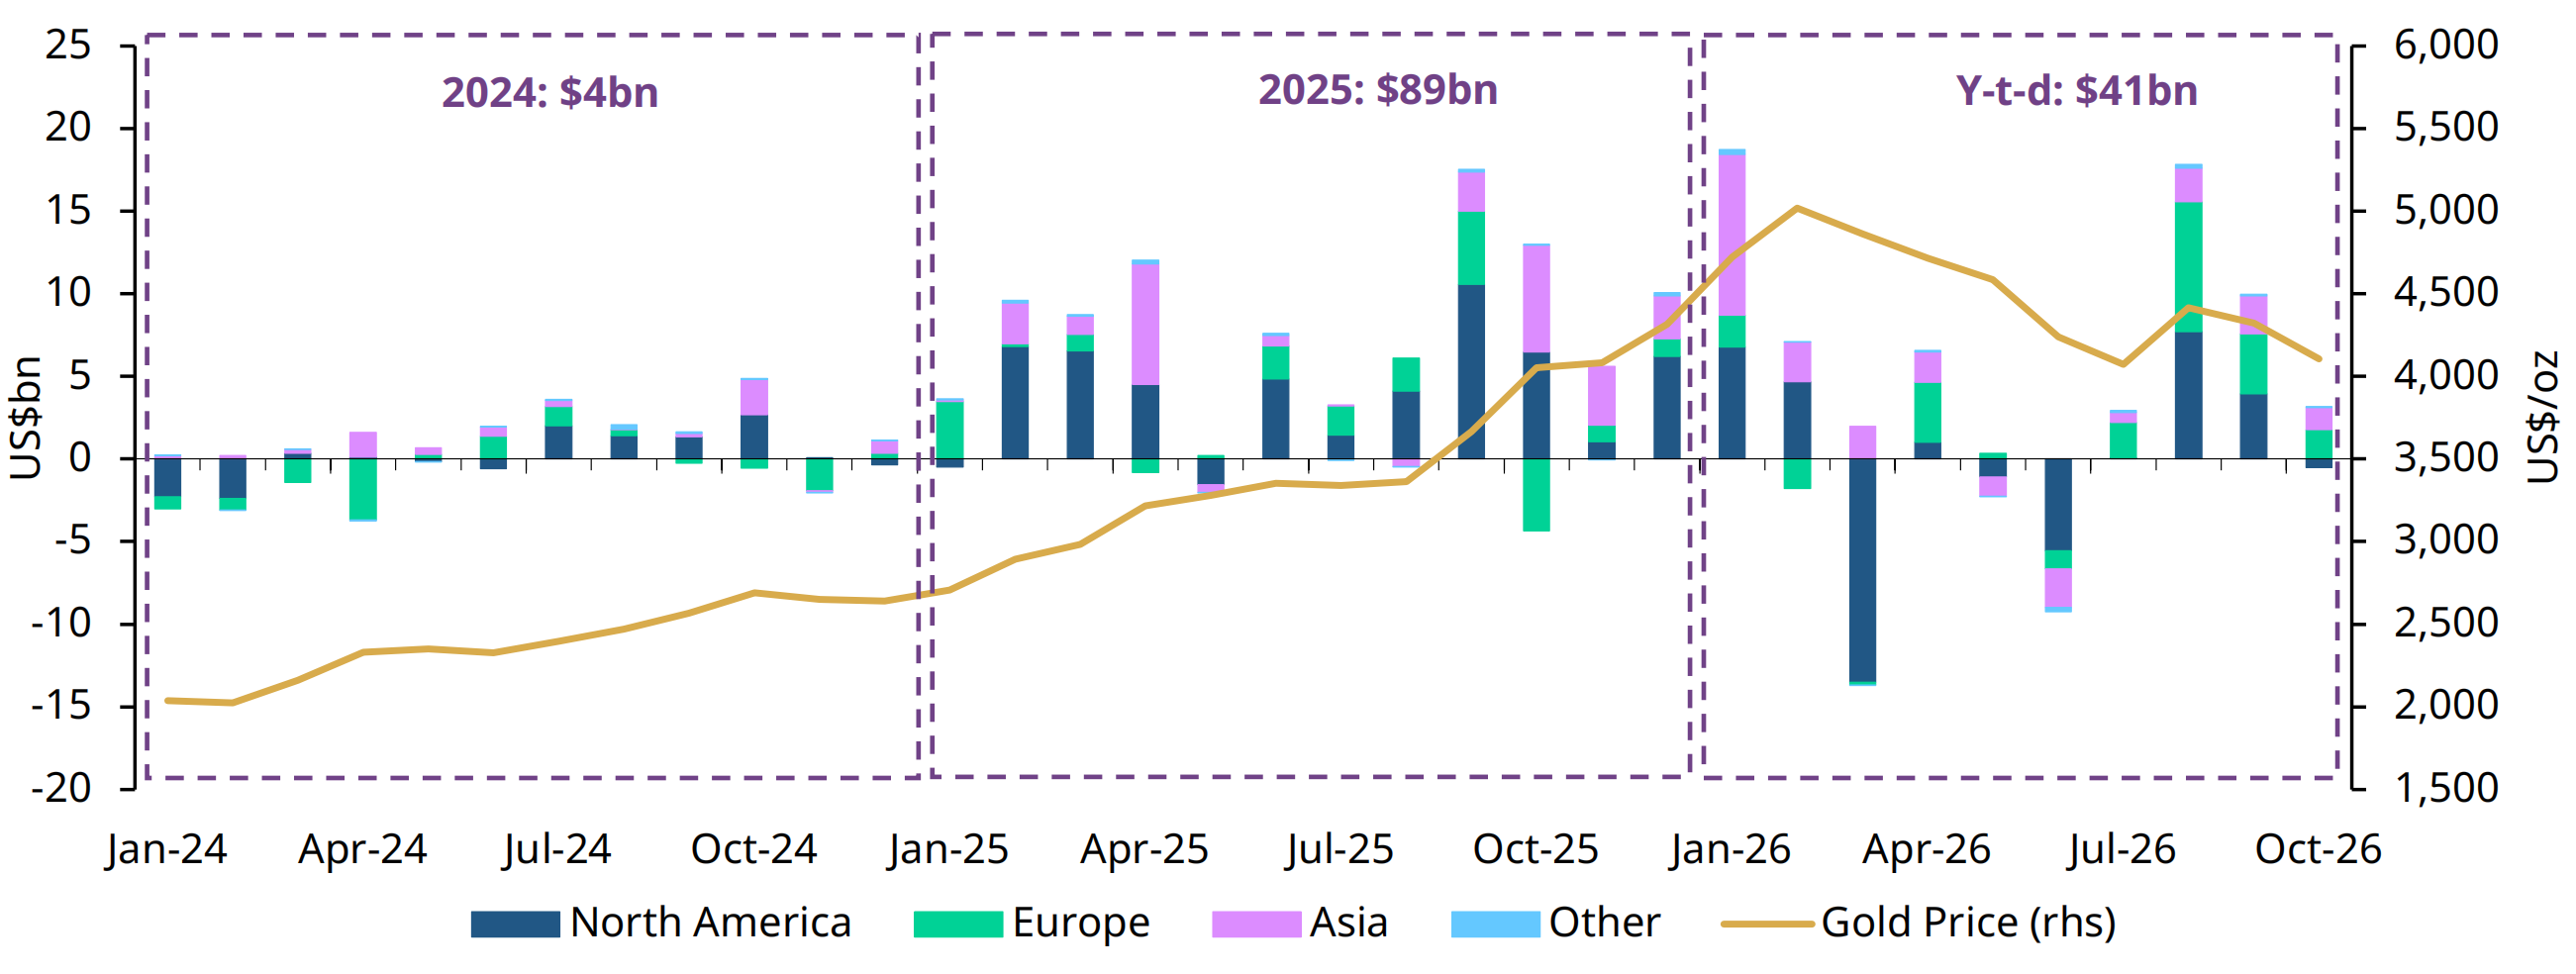 Chart: Monthly ETF flows by region in billions of dollars, compared with the gold price (Source: World Gold Council)
ETF flows turned positive again in the third quarter at 211 tonnes, equivalent to $31 billion. The second quarter had still recorded outflows of 47 tonnes. The WGC defines investment demand as the combined demand for bars and coins and physically backed gold ETFs. This fell by 14% in the third quarter. An earlier estimate of 400 tonnes of investment demand in 2026 was revised down to 200 tonnes. There is, however, also a case for including jewellery consumption in the investment-demand category. The WGC classifies jewellery as decorative, but particularly in Asia, jewellery is also frequently purchased as a way to preserve purchasing power.