English
EN


Gold broke below the $3,800-per-troy-ounce support level this morning, while silver fell more than 3% towards $45. What triggered the sell-off? Fresh comments from Federal Reserve officials pointing to multiple interest rate hikes. Markets now see a more than 95% chance of a rate hike in December. At Holland Gold, we are seeing more long-term investors buying the dip than selling their holdings. But when will gold and silver recover, and where might prices bottom out?
On Wednesday morning, gold fell more than 2% from Tuesday's close to $3,765 per troy ounce (€3,431). It was the third consecutive day of declines, taking gold below $3,800 for the first time since September 2025. Gold has now lost more than 30% of its value since reaching a record high of nearly $5,600 in late January. Silver also fell, dropping 3.2% to $45.73. International precious metal prices are commonly quoted per troy ounce, equivalent to 31.1 grams and the standard weight of a one-ounce gold or silver coin. The charts below show price movements per kilogram since the start of 2026.
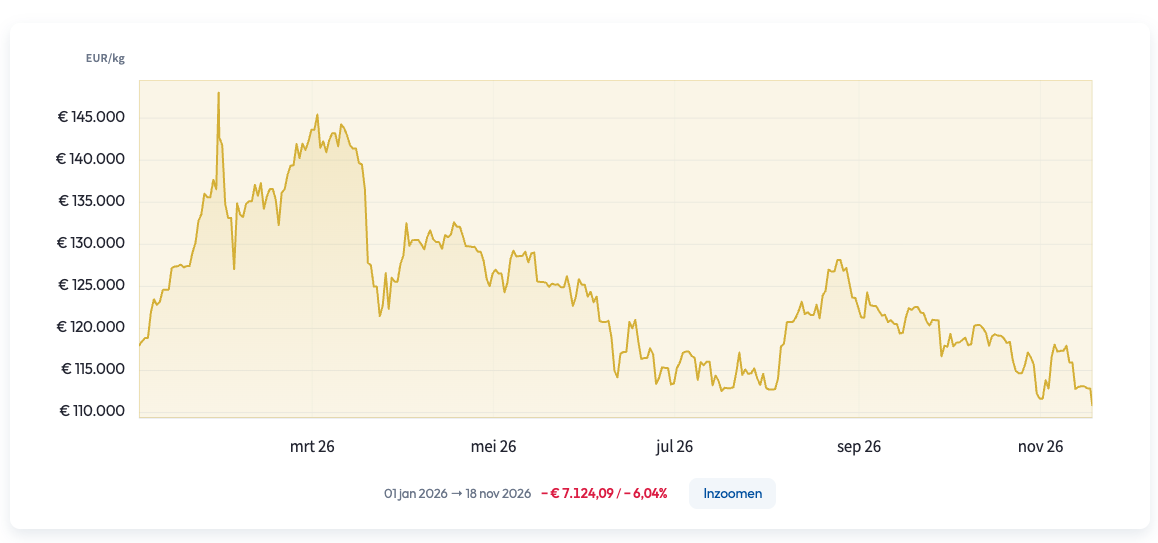 Gold price in euros per kilogram since 1 January 2026. The decline has been smaller in euro terms than in US dollars, as the dollar has strengthened. (Source: Holland Gold).
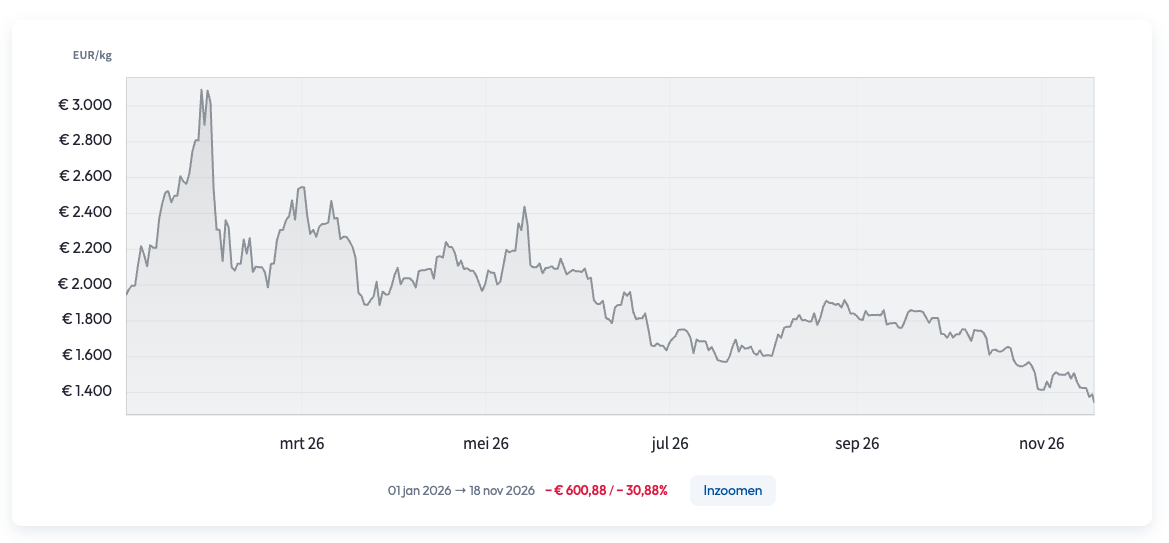 Silver price in euros per kilogram since 1 January 2026: a decline of almost 31%. (Source: Holland Gold).
With gold falling below $3,800, analysts say it has breached a key support level. A support level is a price at which buyers have previously stepped in. Round numbers such as $3,800 tend to attract large numbers of buy and sell orders. When the price breaks through such a level, it can trigger automatic selling and accelerate the decline.
The question now is: where is the next floor? According to StoneX, the key test will be whether gold ends the week above or below $3,870. At $3,765, it is already well below that threshold. If it stays there, StoneX does not rule out a further decline to $3,680, or potentially $3,400. CPM Group, by contrast, expects gold to stabilise around $3,800, with further support near $3,500. Christopher Wong of Singapore-based bank OCBC also warns that the longer gold remains below $4,000, the greater the risk of renewed selling pressure. Although forecasts differ, analysts are generally bracing for further weakness in the near term.
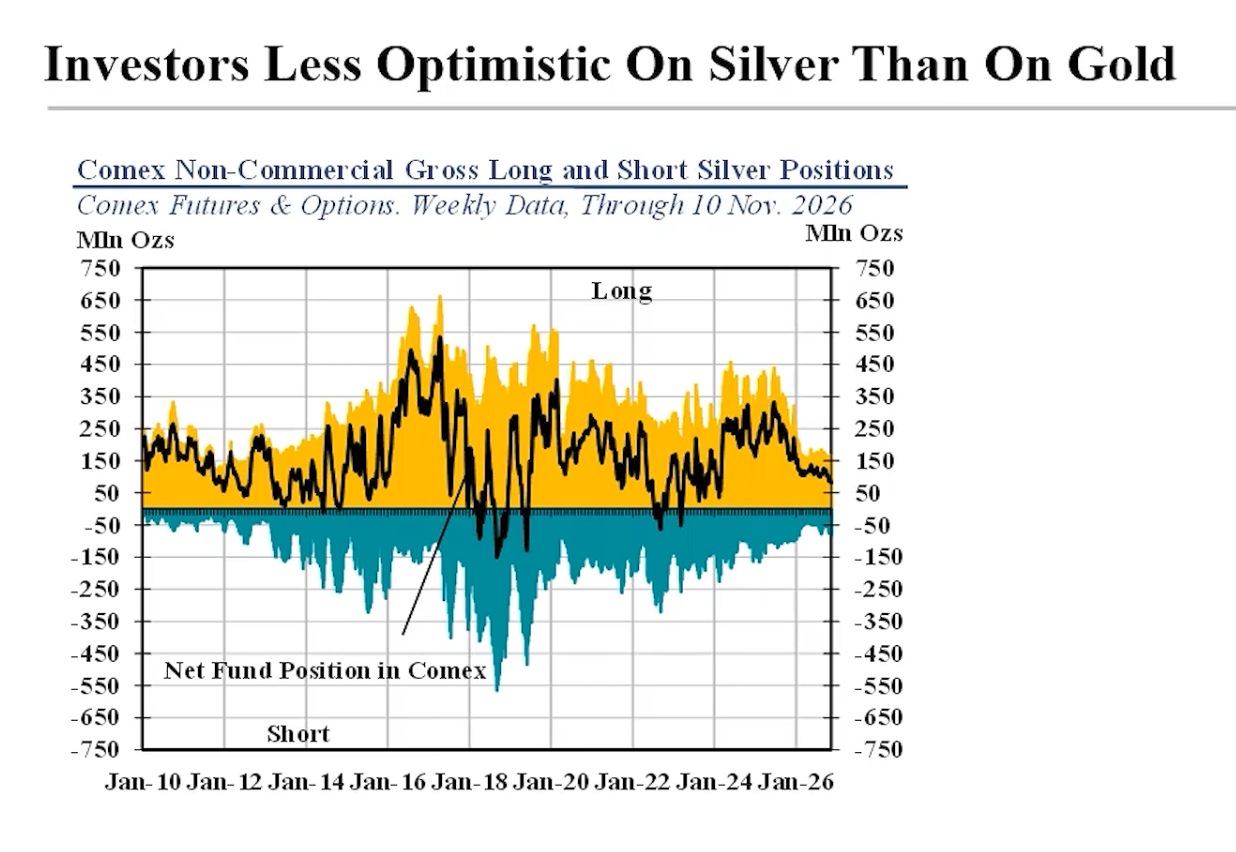 Net speculative positions in silver on COMEX (black line), with short positions (bets on falling prices) in blue and long positions (bets on rising prices) in yellow. All positions are shown in millions of troy ounces, weekly from January 2010 through 10 November 2026. The lower figures compared with previous years partly reflect the fact that, at higher prices, the same financial exposure requires fewer ounces. (Source: CPM Group).
For silver, StoneX identifies the $45 to $45.50 range as a key level. This marks the October 2025 low and is a level that has been significant since 1980. Jeffrey Christian of CPM Group points to another development. In the futures market, where gold and silver contracts are traded, a divergence appears to be emerging between the two metals. Bearish speculation is easing in gold, while traders are becoming slightly more inclined to bet against silver. Meanwhile, ETFs (exchange-traded funds backed by physical metal) are net buyers of gold. Gold therefore appears to be attracting more investor interest than silver, which is why Christian sees technical support for silver only around $38 to $40.
The Federal Reserve, or Fed, is the US central bank. It sets interest rates for the dollar, the world's reserve currency, thereby indirectly influencing the cost of money around the world. In September, the Fed began raising interest rates again for the first time in three years.
On Tuesday, Alberto Musalem of the St. Louis Fed said the economy would probably need ‘several rate hikes’ before spring. John Williams of the New York Fed said there was still ‘work to do’ to bring inflation down to 2%. According to the CME FedWatch Tool, markets were pricing in a 95.7% probability of a rate hike on 9 December as of Wednesday morning.
When interest rates rise, savings and bonds can become more attractive than gold for some investors, as gold pays no interest. Higher rates can also strengthen the dollar, making gold more expensive for buyers outside the US. And interest rate expectations are shifting rapidly. Before last week, markets expected roughly 0.5 percentage points of rate increases by September 2027. That figure has now risen to more than 0.8 percentage points.
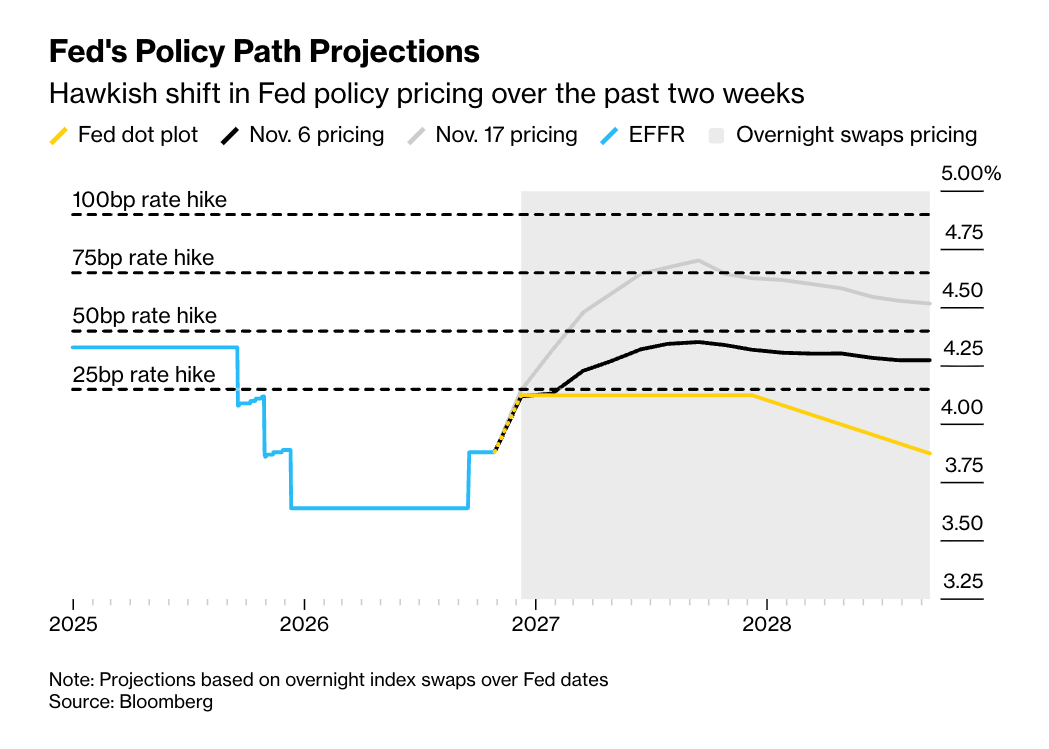 Expected Fed interest rates as of 6 November (black line) and 17 November (grey line). The latter is substantially higher than Fed officials' own projections (yellow line, the so-called ‘dot plot’). The blue line shows the actual interest rate to date. (Source: Bloomberg).
Investors normally turn to gold during periods of turmoil, but that safe-haven support has been notably absent. The S&P 500 lost 1% on Tuesday and fell below its 200-day moving average, a widely watched indicator of the long-term trend. The AEX fell 2.1%, with ASML down more than 5% following new US export restrictions on AI chips. Nvidia reported better-than-expected results, but its share price gains quickly faded, while markets in Asia also remained unsettled.
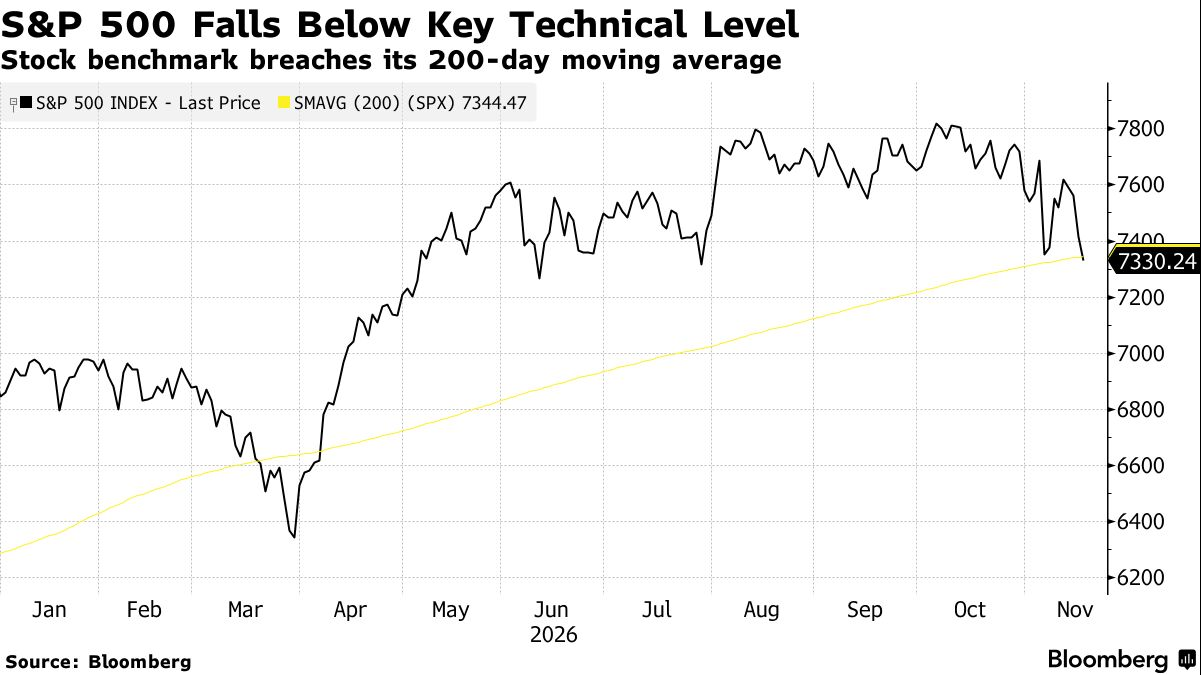 The S&P 500 fell below its 200-day moving average (yellow line). (Source: Bloomberg).
Precisely because gold can be sold quickly, investors use it to offset losses on equities. Safe-haven flows are now heading primarily into US Treasuries and the dollar, which has gained in six of the past seven trading sessions. Even so, the yield on the 10-year US Treasury remains above 5%. It has spent 27 trading days above that threshold this year, almost matching the 29 days recorded in 2007. According to JPMorgan Asset Management, this reflects uncertainty about Fed policy, a strong economy and the large volume of new bonds being issued by the US government and AI companies.
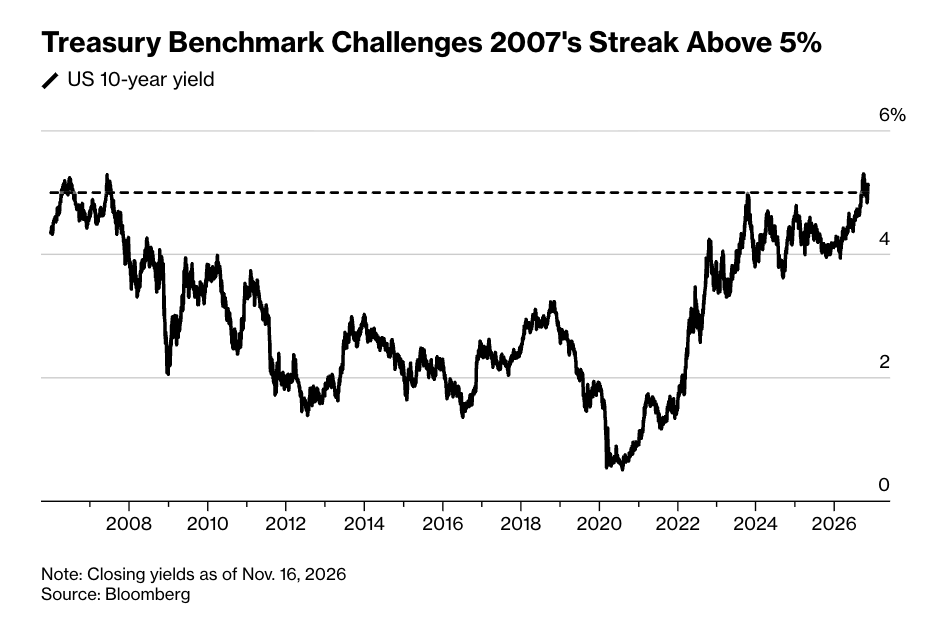 The yield on 10-year US Treasuries is approaching its longest stretch above 5% since 2007. (Source: Bloomberg).
Even lower oil prices are offering little relief. Brent crude is down around 20% in November to approximately $92 a barrel, as exports through the Strait of Hormuz remain steady despite renewed attacks involving Iran and the US. But the Fed is focusing primarily on October's higher-than-expected inflation, while Williams sees the surge in AI investment as a persistent driver of inflation.
Analysts remain cautious in the short term, according to Dutch financial newspaper FD. ING expects gold to remain ‘volatile’. Commerzbank believes interest rate expectations have already risen so far that they could help put a floor under the gold price.
Over the longer term, the outlook is more positive. Goldman Sachs forecasts gold at $4,650 by the end of 2027, equivalent to around €4,240 per troy ounce, and back at $5,600 by the end of 2028. The reason? Central banks continue to buy gold, purchasing an average of 60 tonnes a month, compared with 17 tonnes before 2022. Since the freezing of Russian assets, emerging-market countries in particular have increasingly diversified their reserves into gold. The catalyst for a return to $5,600 would be the Fed cutting interest rates again and Western investors returning to the market.
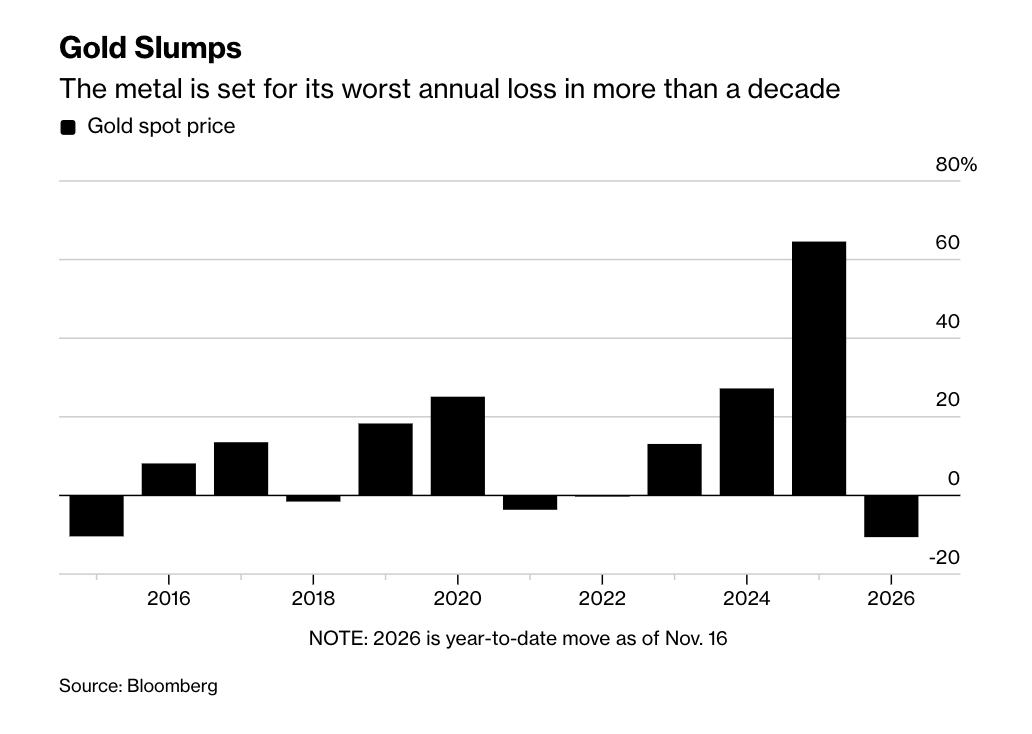 Gold is heading for its biggest annual loss in more than a decade, following a gain of over 60% in 2025. (Source: Bloomberg).
ABN AMRO expects gold to reach around $5,000 by the end of 2027, as geopolitical tensions and rising government debt increasingly appear to be structural factors. Like Goldman Sachs, JPMorgan Private Bank is focused primarily on interest rates. ‘Gold will find a solid floor when interest rates peak,’ strategist Yuxuan Tang said in late October. At the time, the bank forecast gold at $5,000 by the end of 2027 and suggested that central banks could start buying again below $4,000.
The next clue about the Fed's policy outlook will come tonight at 8:00 pm, when the minutes of its October meeting are released. The next interest rate decision is due on 9 December.