9.4
7.521 Reviews

English
EN
This contribution comes from the Boon & Knopers Substack
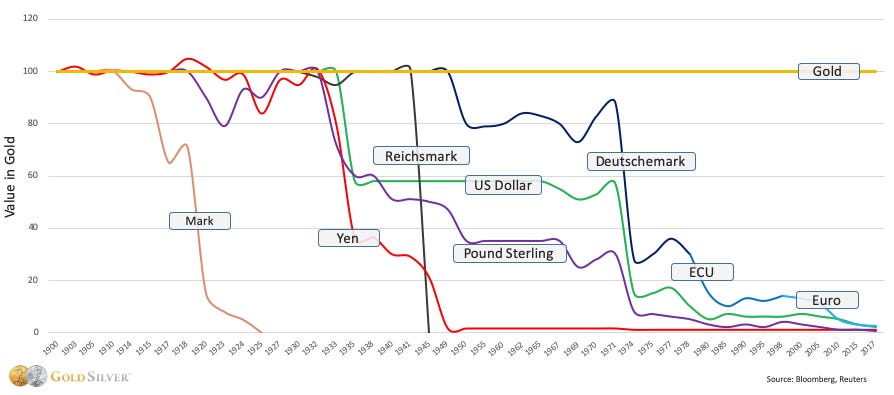
In recent decades, the valuations of stocks, gold and real estate have risen spectacularly, but that is largely because we use currency as a reference point of value. Wrongly, because in the medium and long term, the purchasing power of all currencies evaporates. Whether it's U.S. dollars, euros or Japanese yen, they are all depreciating. The logical consequence is that all prices rise when measured in currency.

Value of currency compared to gold (Source: GoldSilver)
That is why we have been advocating gold as a reference point of value for some time. The quality of the precious metal always remains the same and the supply grows at a slow and predictable rate, especially compared to the money growth of currencies. A kilo of gold will always remain the same and will still fulfil the same function today as it did thirty or fifty years ago. In fact, gold has been the reference point of value longer than fiat money throughout history.
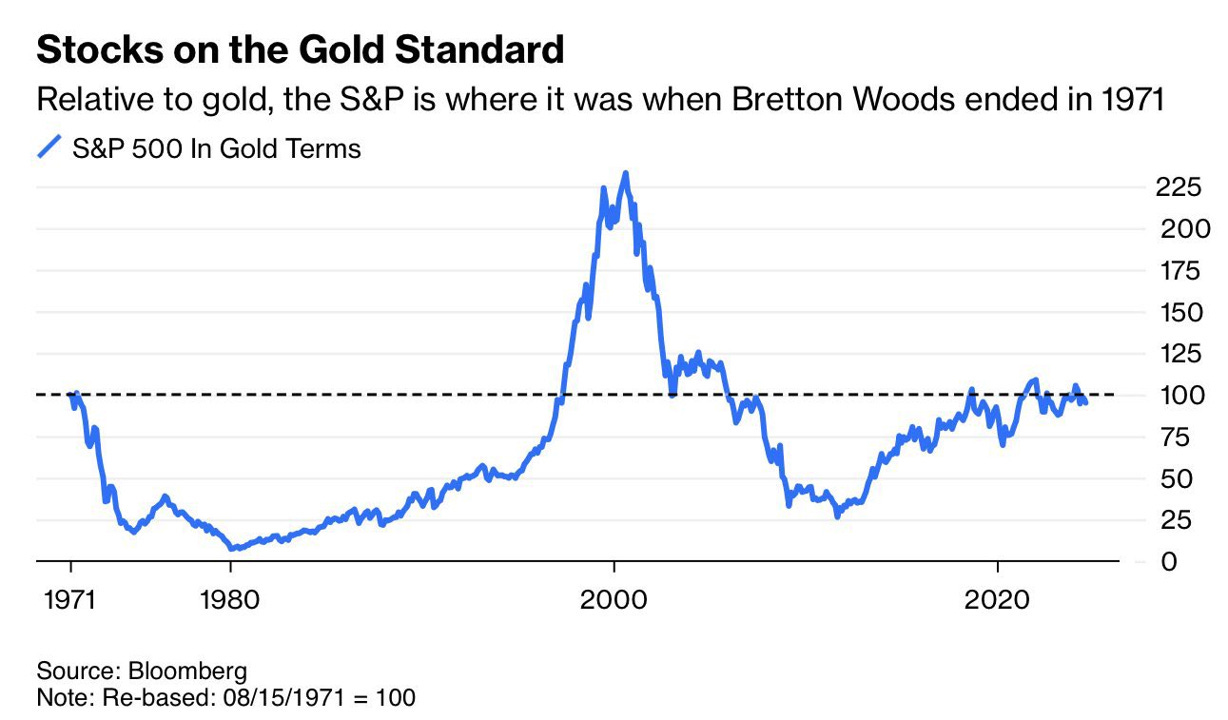
If we look at the world from this perspective (all prices and rates measured in gold), we can see whether there is a relative increase in value in addition to a price increase. And that leads to interesting observations, such as the graph below from Bloomberg. This shows the price development of the American S&P 500 stock index, but measured in gold. Seen from this perspective, U.S. equities have not appreciated since 1971. We can also conclude that there is no bubble in the stock market as a whole, at most in a number of popular stocks within the technology sector.

Value of US S&P 500 stock index, measured in gold (Source: Bloomberg)
Still, we have to make an important note about this chart from Bloomberg. It doesn't tell the full story. After all, the return on shares does not only consist of price development, but also of dividends that companies pay out to shareholders.
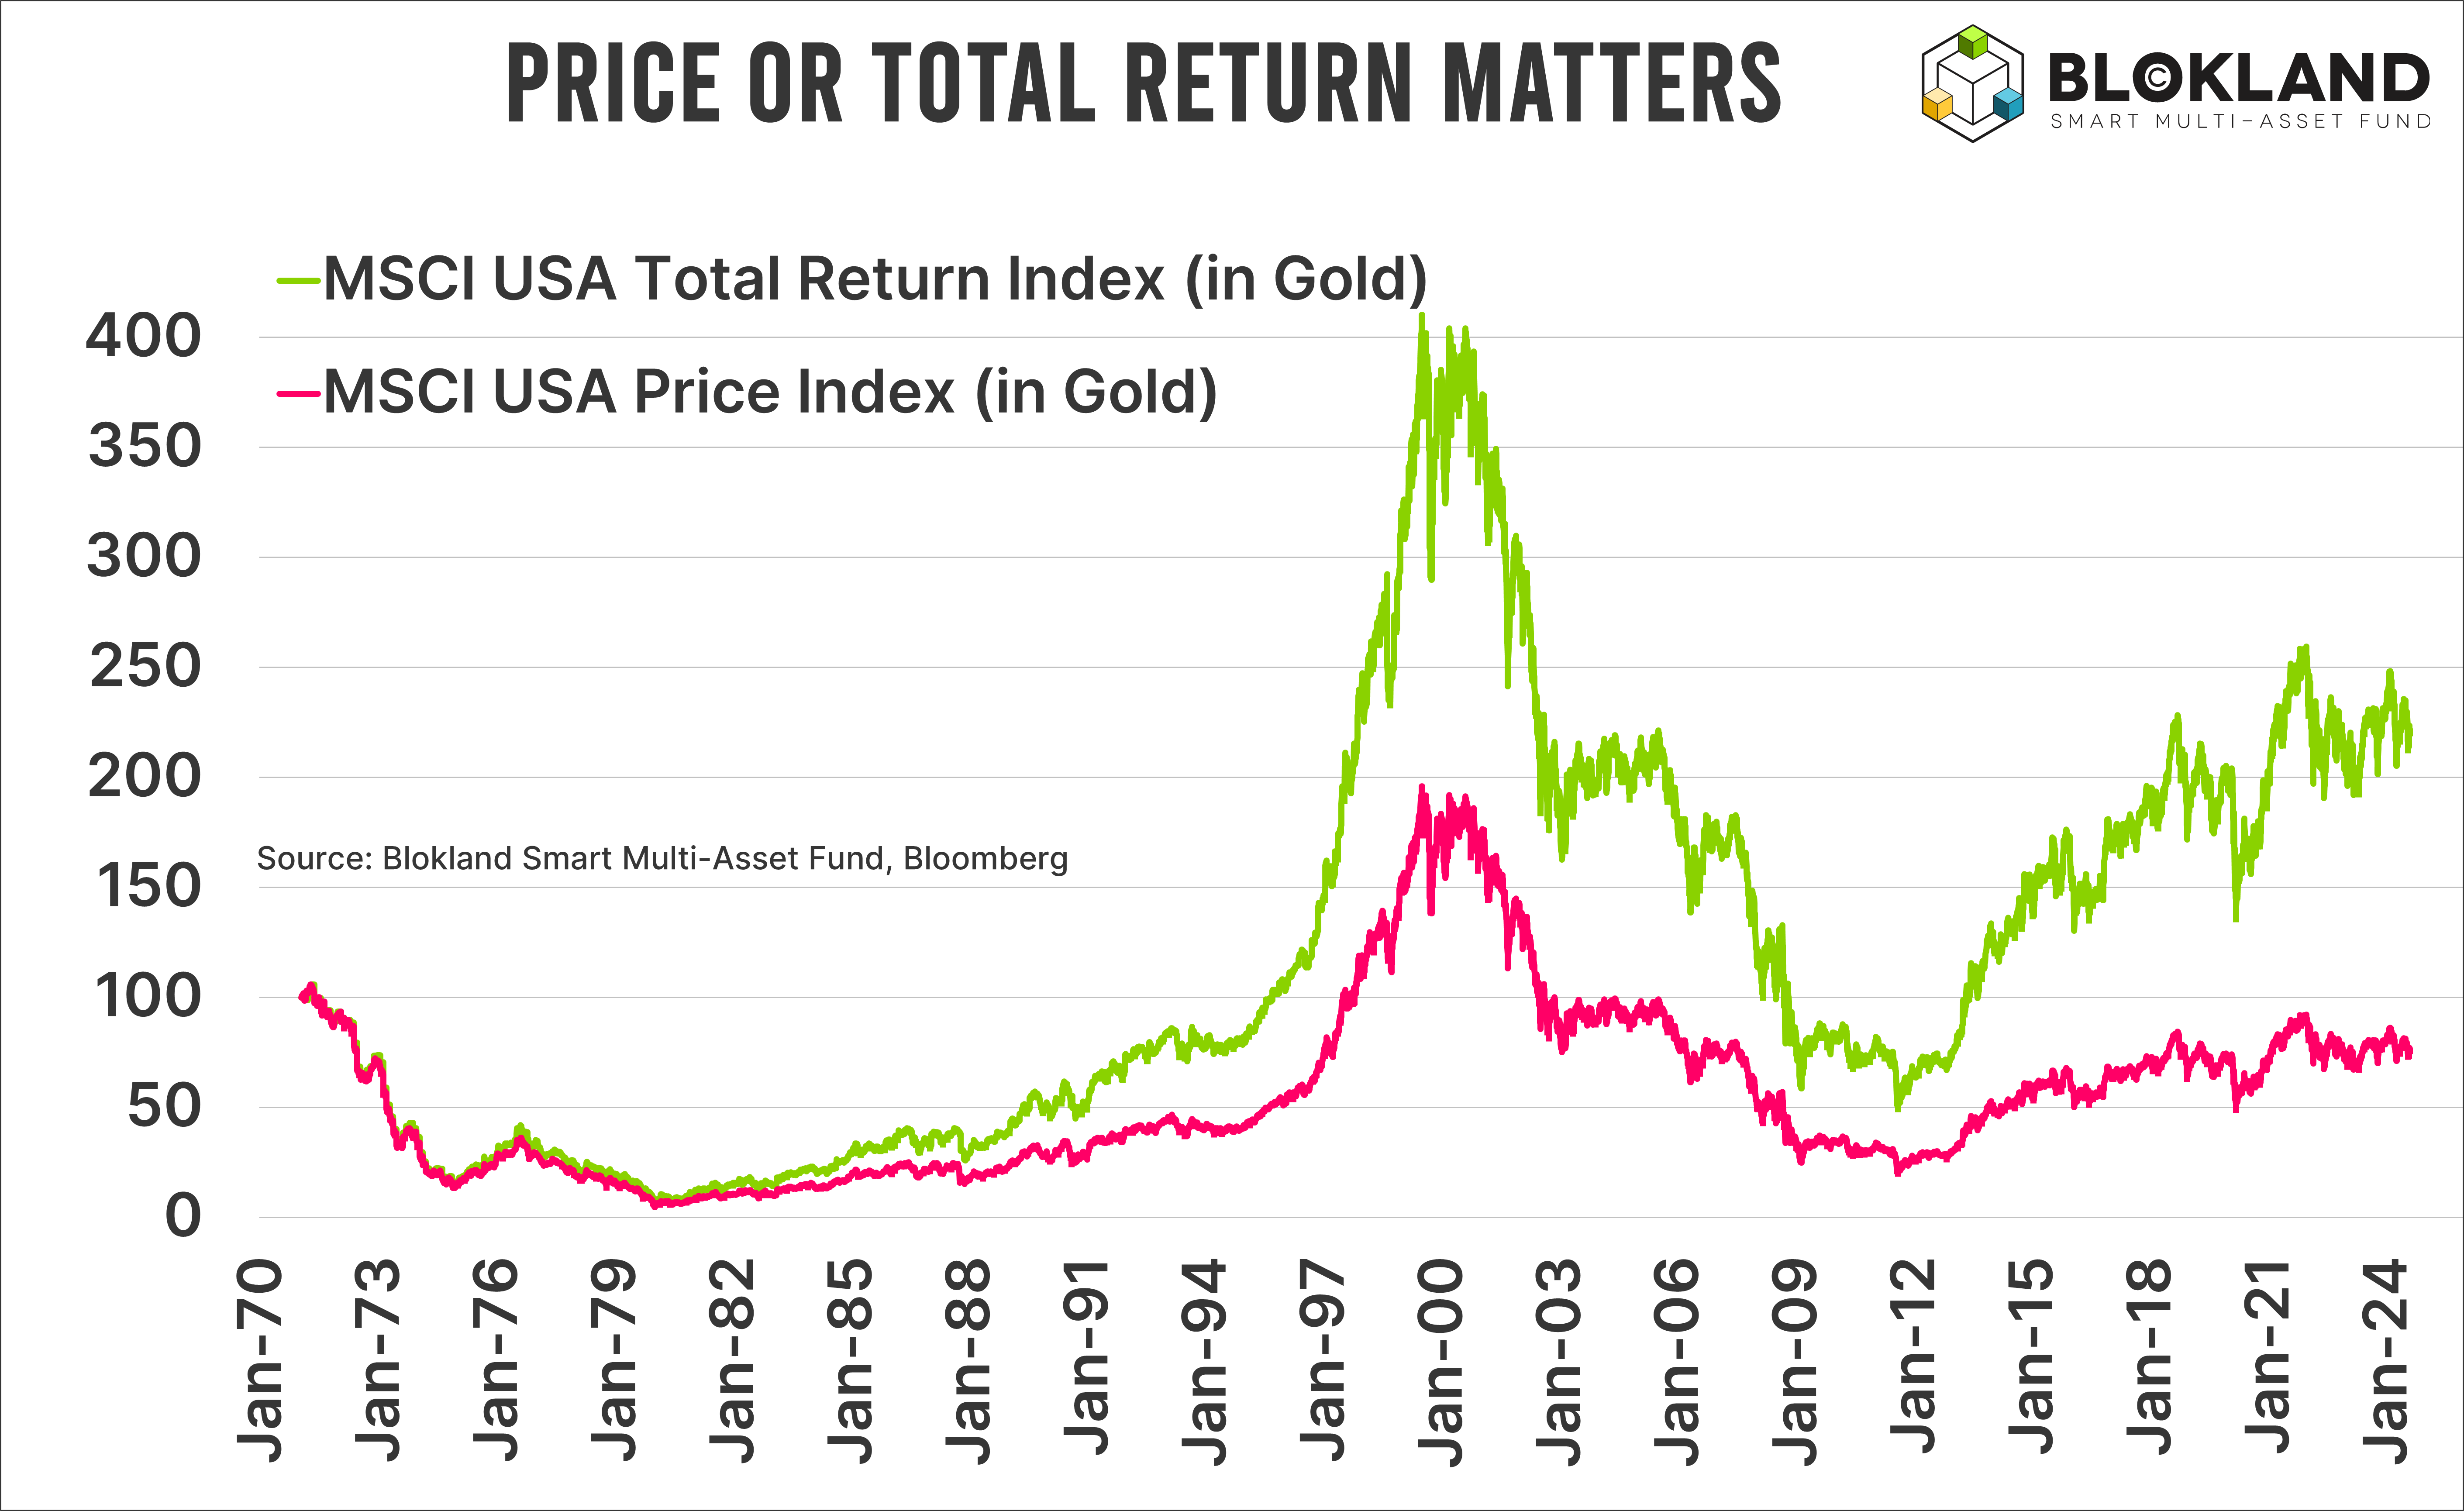
Jeroen Blokland of the Blokland Smart Multi Asset Fund rightly noted this and made it clear on the basis of the graph below how big the effect of dividends is on the total return over the longer term. On the chart, the pink line shows the price performance of US shares (MSCI index) measured in gold, while the green line shows the total return, which also includes dividends. This comparison is fairer and shows that wealth in stocks more than doubled between 1971 and 2024, measured in gold. But that is much more due to the dividend than to the increase in value.

Returns of US stocks with and without dividends, measured in gold (Source: Jeroen Blokland)
So we also need to look at dividends to be able to compare the performance of equities and gold. Then it turns out that U.S. equities, with returns averaging almost 10 percent per year, did indeed outperform gold, which gained about 8 percent per year over the same period. Still a good result, by the way, if you consider that gold actually 'does nothing' and has no counterparty risk whatsoever.
This leads us to the following conclusions:
U.S. stocks have outperformed gold since 1971, when dividends are included.
Both gold and U.S. stocks have performed well since 1971, when returns are measured in currencies.
In the long run, currencies are not a reliable reference point of value. Gold is a better reference point to determine whether investments (stocks, real estate, commodities, and the like) have increased in value.
(Photo credit: Bank of England)
Have a look at us YouTube channel
On behalf of Holland Gold, Paul Buitink interviews various economists and experts in the macroeconomic field. The aim of the podcast is to provide the viewer with a better picture and guidance in an increasingly rapidly changing macroeconomic and monetary landscape. Click here to subscribe.
