English
EN


August has started strongly, but what does gold need to break out? In this technical analysis, we review the latest figures, focusing on the Fed, 10-year US Treasuries and the WGC monthly report, which maps global gold demand.
The precious metals got off to a strong start in August after gold had already posted a positive return in July. At 1.2%, this was very modest, but it nevertheless marked a break with the previous four months, each of which ended with a negative return. Historically, August and September, together with January and November, are the months in which gold performs best. After just over seven months of 2026, gold is now down 2% in US dollar terms and at break-even in euro terms. Silver continues to lag for now and is down 13% in US dollar terms and 11% in euro terms.
To convincingly resume the upward trend, gold must break above its 200-day moving average again, which currently stands at $4,482. It flattened considerably over recent weeks, but nevertheless promises to be a tough technical resistance level. Silver has even more work to do, as its 50-day moving average has not yet been breached. It currently stands just below $63. Silver’s 200-day moving average is currently just above $70. The gold/silver ratio remained fairly stable over recent weeks.
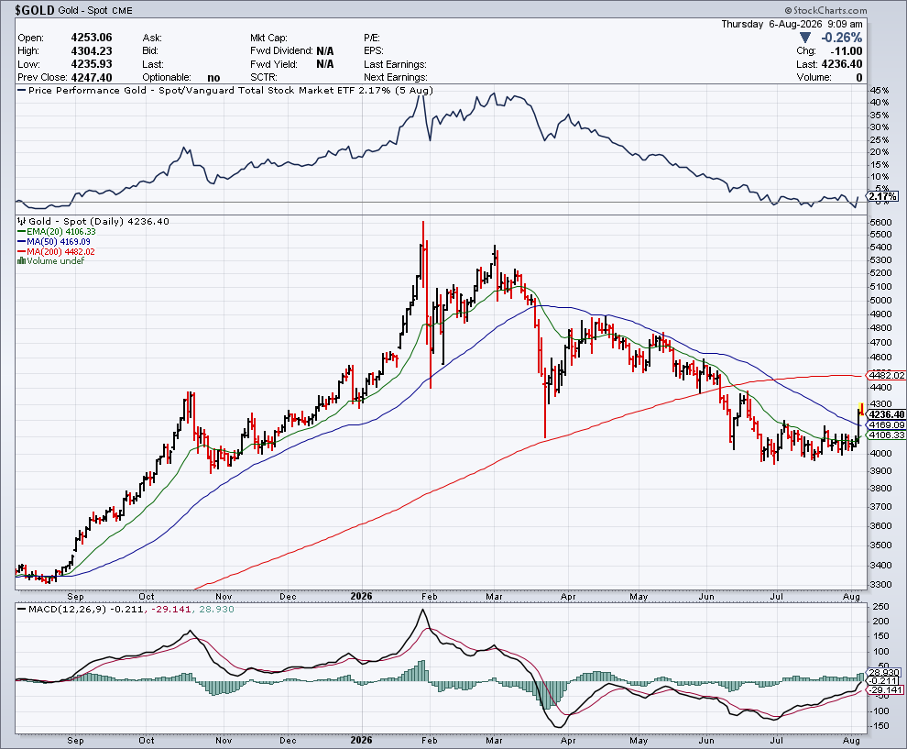 Chart: gold price over one year with 50-day and 200-day moving averages (Source: StockCharts)
All in all, the gold price held up well recently in an environment that was hostile to gold, characterised by rising interest rates and a stronger dollar.
The Federal Reserve’s policy committee, chaired by Kevin Warsh, kept the policy rate unchanged on July 29 but provided no clear guidance for the coming months. This left the market free to take matters into its own hands, initially resulting in sharply rising interest rates. The yield on the 30-year government bond crossed the 5.3% threshold and was therefore at its highest level since 2007. The yield on 10-year government bonds is also relatively high at 4.7%. The yield on two-year US government bonds, or the US 2-year note, which has a high correlation with the federal funds rate, has already priced in an interest-rate increase later this year, rising from 3.5% to 4.3%. These rising yields across all maturities are not good news for the US government.
Warsh reiterated on several occasions that he wants to fight inflation. If he follows through on his words, an interest-rate increase appears inevitable. However, the elephant in the room is the high level of US government debt. At the federal level, it is approaching $40 trillion. Roughly one-fifth of this debt must be refinanced within the next four months, while one-third will follow within 12 months. Higher interest rates therefore mean that the government’s interest expenses will continue to rise.
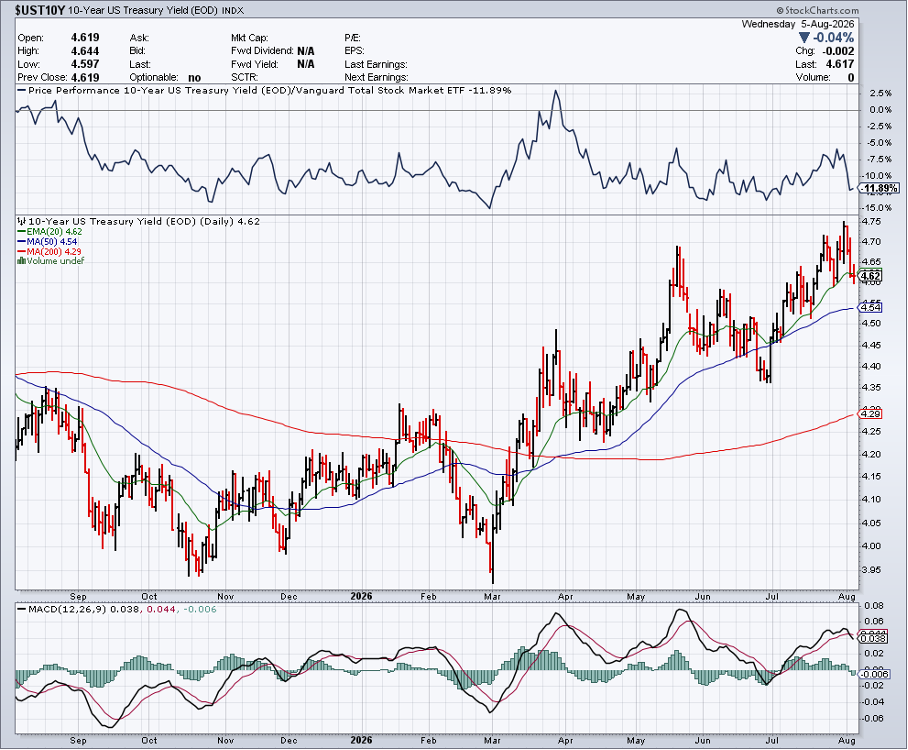 Chart: yield on the 10-year US Treasury (Source: StockCharts)
The way the market interprets the daily flow of macroeconomic and geopolitical news is not always unambiguous and is often unpredictable. This is also reflected in high volatility in interest-rate expectations. The Fed’s policy committee will meet three more times later this year. According to the CME FedWatch Tool, slightly more than half of the market currently expects a first interest-rate increase at the upcoming meeting on September 16. Earlier this week, this figure was still two-thirds.
The trigger was a lower-than-expected figure for the number of newly created jobs, which reduces the likelihood of interest-rate cuts. Tomorrow afternoon, Thursday, August 7, the official BLS employment report for July is scheduled to be released.
Gold was in demand again and was also supported by reports of yet another reopening of the Strait of Hormuz. Unrest in the currency markets also played into gold’s hands. The joint intervention by the United States and Japan to support the yen may indicate tensions within the monetary system.
The World Gold Council (WGC) published its new World Gold Demand Trends Report on July 30, compiled by market research firm Metals Focus.
During the second quarter, total gold demand remained virtually unchanged year on year at 1,269 tonnes. Over the full first half of the year, this figure amounted to 2,522 tonnes, 2% more than in the same period a year earlier. In nominal terms, that volume represented a new record of $380 billion. The average gold price was $4,506.39 in the second quarter, measured using the LBMA PM fixing price. This was 8% lower than in the first quarter, but 37% higher than in the second quarter of last year.
The downward revision to central-bank gold purchases in the first quarter was discussed here previously. The WGC has now moved a large portion of the demand that was assigned to the Central Banks category in the first quarter to the OTC & Other category. OTC refers to over-the-counter transactions that take place outside a regulated exchange and are concluded directly between two market participants. The total demand figure for Q1 therefore remains unchanged; only the category has changed. Physical gold flows are not always transparent, and various central banks report their positions to the IMF either incompletely or with a delay.
Physical gold ETFs recorded an outflow of 44.8 tonnes in the second quarter, but the figure for the first half of the year remains positive at 18 tonnes. Demand for gold bars and coins stood at 307.1 tonnes, 3% lower than in the same period a year earlier. It should be noted that this decline applies only in volume terms. Expressed in nominal value, whether in dollars, euros or other currencies, there was an increase. Jewellery consumption fell by 17% to 278.2 tonnes.
Holland Gold Event(50% of tickets already sold!) On October 8, Holland Gold will bring well-known podcast guests to Theater Figi in Zeist for Freedom & Wealth 2026. View the programme and reserve your ticket for an evening about the future of the Netherlands, Europe and your wealth. |